Mexican vs Slavic Unemployment Among Ages 35 to 44 years
COMPARE
Mexican
Slavic
Unemployment Among Ages 35 to 44 years
Unemployment Among Ages 35 to 44 years Comparison
Mexicans
Slavs
5.3%
UNEMPLOYMENT AMONG AGES 35 TO 44 YEARS
0.1/ 100
METRIC RATING
259th/ 347
METRIC RANK
4.6%
UNEMPLOYMENT AMONG AGES 35 TO 44 YEARS
72.4/ 100
METRIC RATING
148th/ 347
METRIC RANK
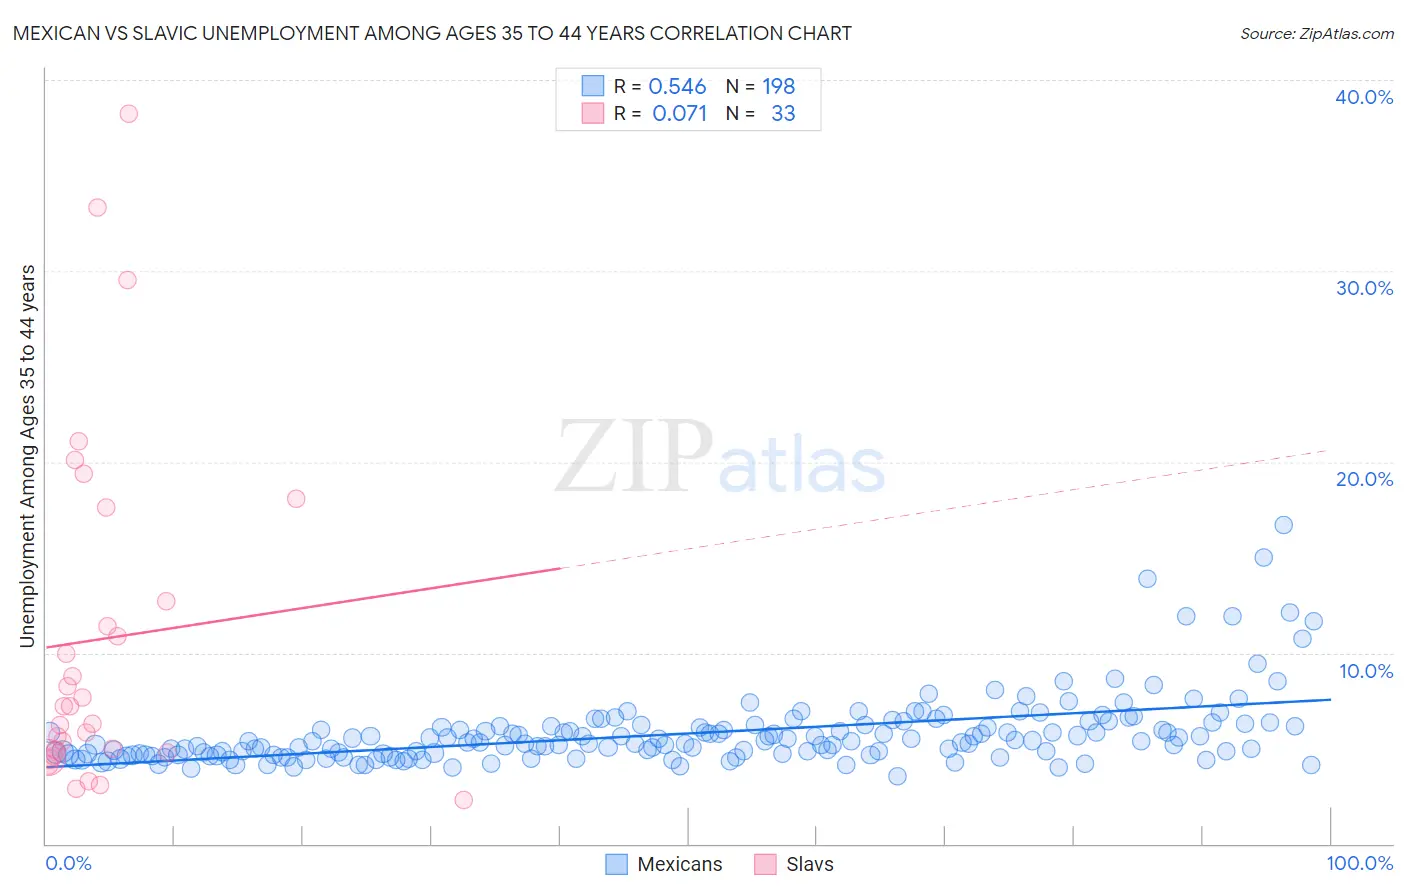
Mexican vs Slavic Unemployment Among Ages 35 to 44 years Correlation Chart
The statistical analysis conducted on geographies consisting of 530,210,918 people shows a substantial positive correlation between the proportion of Mexicans and unemployment rate among population between the ages 35 and 44 in the United States with a correlation coefficient (R) of 0.546 and weighted average of 5.3%. Similarly, the statistical analysis conducted on geographies consisting of 265,902,983 people shows a slight positive correlation between the proportion of Slavs and unemployment rate among population between the ages 35 and 44 in the United States with a correlation coefficient (R) of 0.071 and weighted average of 4.6%, a difference of 14.3%.
Unemployment Among Ages 35 to 44 years Correlation Summary
| Measurement | Mexican | Slavic |
| Minimum | 3.5% | 2.3% |
| Maximum | 16.7% | 38.2% |
| Range | 13.2% | 35.9% |
| Mean | 5.8% | 10.7% |
| Median | 5.3% | 7.2% |
| Interquartile 25% (IQ1) | 4.7% | 4.7% |
| Interquartile 75% (IQ3) | 6.2% | 15.1% |
| Interquartile Range (IQR) | 1.5% | 10.4% |
| Standard Deviation (Sample) | 1.9% | 9.1% |
| Standard Deviation (Population) | 1.8% | 9.0% |
Similar Demographics by Unemployment Among Ages 35 to 44 years
Demographics Similar to Mexicans by Unemployment Among Ages 35 to 44 years
In terms of unemployment among ages 35 to 44 years, the demographic groups most similar to Mexicans are Subsaharan African (5.3%, a difference of 0.030%), Immigrants from Latin America (5.3%, a difference of 0.090%), Immigrants from Fiji (5.3%, a difference of 0.21%), Spanish American (5.3%, a difference of 0.23%), and Seminole (5.2%, a difference of 0.50%).
| Demographics | Rating | Rank | Unemployment Among Ages 35 to 44 years |
| Armenians | 0.2 /100 | #252 | Tragic 5.2% |
| Mexican American Indians | 0.2 /100 | #253 | Tragic 5.2% |
| Immigrants | Bahamas | 0.2 /100 | #254 | Tragic 5.2% |
| Cherokee | 0.2 /100 | #255 | Tragic 5.2% |
| Seminole | 0.1 /100 | #256 | Tragic 5.2% |
| Immigrants | Fiji | 0.1 /100 | #257 | Tragic 5.3% |
| Immigrants | Latin America | 0.1 /100 | #258 | Tragic 5.3% |
| Mexicans | 0.1 /100 | #259 | Tragic 5.3% |
| Sub-Saharan Africans | 0.1 /100 | #260 | Tragic 5.3% |
| Spanish Americans | 0.1 /100 | #261 | Tragic 5.3% |
| Immigrants | Central America | 0.1 /100 | #262 | Tragic 5.3% |
| Choctaw | 0.1 /100 | #263 | Tragic 5.3% |
| Ghanaians | 0.1 /100 | #264 | Tragic 5.3% |
| Yaqui | 0.1 /100 | #265 | Tragic 5.3% |
| Immigrants | Bangladesh | 0.1 /100 | #266 | Tragic 5.3% |
Demographics Similar to Slavs by Unemployment Among Ages 35 to 44 years
In terms of unemployment among ages 35 to 44 years, the demographic groups most similar to Slavs are Immigrants from Burma/Myanmar (4.6%, a difference of 0.020%), Immigrants from Vietnam (4.6%, a difference of 0.12%), Immigrants from England (4.6%, a difference of 0.17%), Immigrants from Denmark (4.6%, a difference of 0.18%), and Immigrants from Eastern Europe (4.6%, a difference of 0.20%).
| Demographics | Rating | Rank | Unemployment Among Ages 35 to 44 years |
| Canadians | 75.9 /100 | #141 | Good 4.6% |
| Ukrainians | 75.8 /100 | #142 | Good 4.6% |
| Immigrants | Switzerland | 75.5 /100 | #143 | Good 4.6% |
| Immigrants | Russia | 75.4 /100 | #144 | Good 4.6% |
| Immigrants | Eastern Europe | 74.7 /100 | #145 | Good 4.6% |
| Immigrants | Denmark | 74.4 /100 | #146 | Good 4.6% |
| Immigrants | Vietnam | 73.8 /100 | #147 | Good 4.6% |
| Slavs | 72.4 /100 | #148 | Good 4.6% |
| Immigrants | Burma/Myanmar | 72.2 /100 | #149 | Good 4.6% |
| Immigrants | England | 70.5 /100 | #150 | Good 4.6% |
| Puget Sound Salish | 67.1 /100 | #151 | Good 4.6% |
| Pakistanis | 67.1 /100 | #152 | Good 4.6% |
| Immigrants | Brazil | 67.0 /100 | #153 | Good 4.6% |
| Immigrants | Western Europe | 65.5 /100 | #154 | Good 4.6% |
| Whites/Caucasians | 64.9 /100 | #155 | Good 4.6% |