Guatemalan vs Immigrants from Panama Unemployment Among Seniors over 65 years
COMPARE
Guatemalan
Immigrants from Panama
Unemployment Among Seniors over 65 years
Unemployment Among Seniors over 65 years Comparison
Guatemalans
Immigrants from Panama
5.6%
UNEMPLOYMENT AMONG SENIORS OVER 65 YEARS
0.0/ 100
METRIC RATING
302nd/ 347
METRIC RANK
5.1%
UNEMPLOYMENT AMONG SENIORS OVER 65 YEARS
83.0/ 100
METRIC RATING
139th/ 347
METRIC RANK
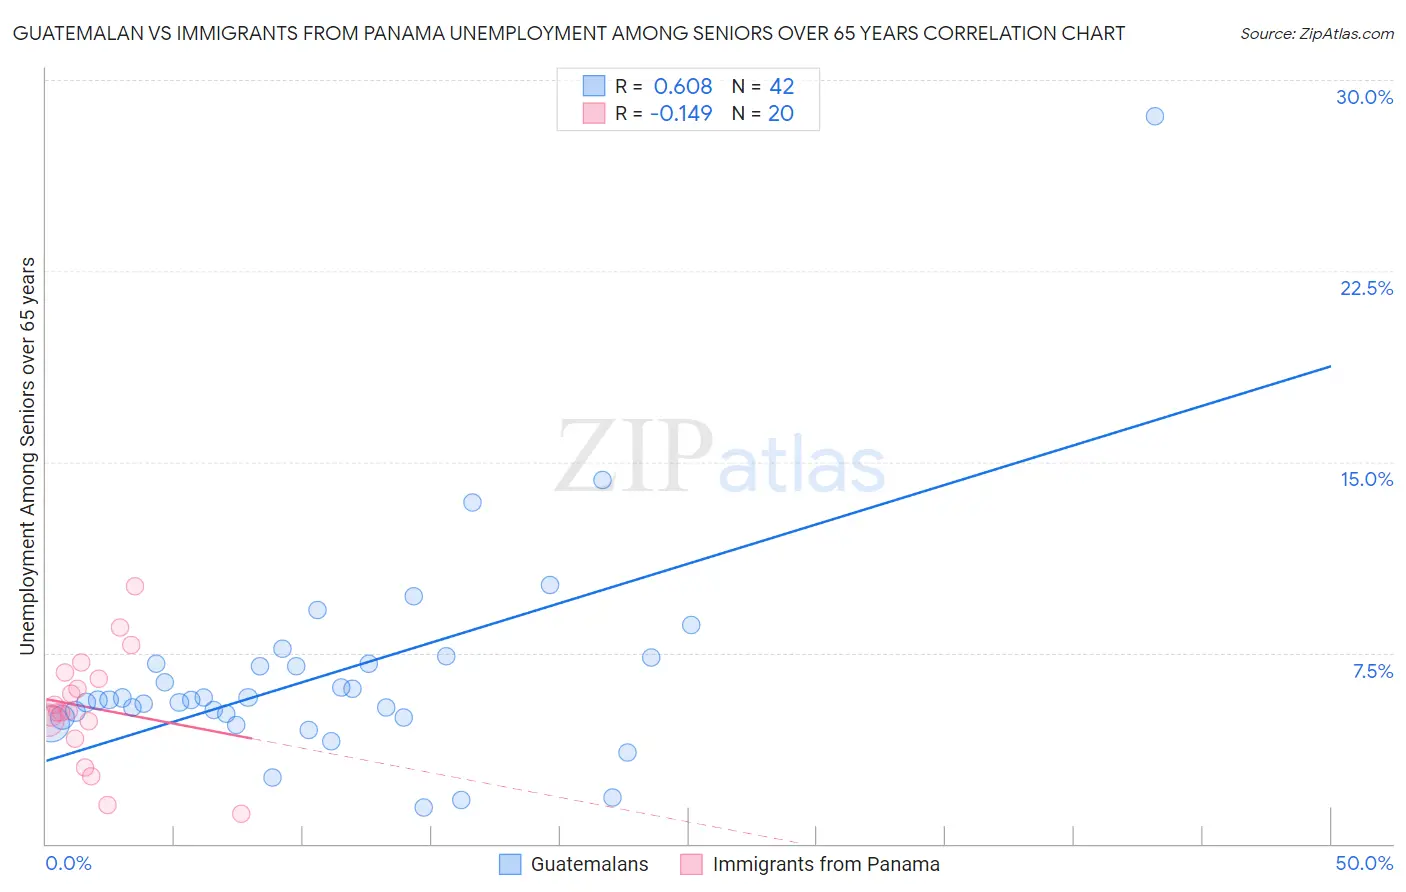
Guatemalan vs Immigrants from Panama Unemployment Among Seniors over 65 years Correlation Chart
The statistical analysis conducted on geographies consisting of 366,813,934 people shows a significant positive correlation between the proportion of Guatemalans and unemployment rate amomg seniors over the age of 65 in the United States with a correlation coefficient (R) of 0.608 and weighted average of 5.6%. Similarly, the statistical analysis conducted on geographies consisting of 209,001,449 people shows a poor negative correlation between the proportion of Immigrants from Panama and unemployment rate amomg seniors over the age of 65 in the United States with a correlation coefficient (R) of -0.149 and weighted average of 5.1%, a difference of 9.8%.
Unemployment Among Seniors over 65 years Correlation Summary
| Measurement | Guatemalan | Immigrants from Panama |
| Minimum | 1.4% | 1.2% |
| Maximum | 28.6% | 10.1% |
| Range | 27.2% | 8.9% |
| Mean | 6.6% | 5.3% |
| Median | 5.7% | 5.2% |
| Interquartile 25% (IQ1) | 5.0% | 4.5% |
| Interquartile 75% (IQ3) | 7.1% | 6.6% |
| Interquartile Range (IQR) | 2.1% | 2.2% |
| Standard Deviation (Sample) | 4.3% | 2.2% |
| Standard Deviation (Population) | 4.3% | 2.2% |
Similar Demographics by Unemployment Among Seniors over 65 years
Demographics Similar to Guatemalans by Unemployment Among Seniors over 65 years
In terms of unemployment among seniors over 65 years, the demographic groups most similar to Guatemalans are Immigrants from Latin America (5.6%, a difference of 0.090%), Hispanic or Latino (5.6%, a difference of 0.16%), Liberian (5.6%, a difference of 0.17%), Mexican (5.6%, a difference of 0.33%), and Zimbabwean (5.6%, a difference of 0.37%).
| Demographics | Rating | Rank | Unemployment Among Seniors over 65 years |
| Cheyenne | 0.0 /100 | #295 | Tragic 5.5% |
| Cape Verdeans | 0.0 /100 | #296 | Tragic 5.5% |
| Yaqui | 0.0 /100 | #297 | Tragic 5.5% |
| Immigrants | West Indies | 0.0 /100 | #298 | Tragic 5.6% |
| Guyanese | 0.0 /100 | #299 | Tragic 5.6% |
| Zimbabweans | 0.0 /100 | #300 | Tragic 5.6% |
| Hispanics or Latinos | 0.0 /100 | #301 | Tragic 5.6% |
| Guatemalans | 0.0 /100 | #302 | Tragic 5.6% |
| Immigrants | Latin America | 0.0 /100 | #303 | Tragic 5.6% |
| Liberians | 0.0 /100 | #304 | Tragic 5.6% |
| Mexicans | 0.0 /100 | #305 | Tragic 5.6% |
| Ecuadorians | 0.0 /100 | #306 | Tragic 5.6% |
| Portuguese | 0.0 /100 | #307 | Tragic 5.6% |
| Immigrants | St. Vincent and the Grenadines | 0.0 /100 | #308 | Tragic 5.6% |
| Immigrants | Guatemala | 0.0 /100 | #309 | Tragic 5.6% |
Demographics Similar to Immigrants from Panama by Unemployment Among Seniors over 65 years
In terms of unemployment among seniors over 65 years, the demographic groups most similar to Immigrants from Panama are Immigrants from Chile (5.1%, a difference of 0.0%), New Zealander (5.1%, a difference of 0.010%), Ukrainian (5.1%, a difference of 0.080%), White/Caucasian (5.1%, a difference of 0.080%), and Arab (5.1%, a difference of 0.080%).
| Demographics | Rating | Rank | Unemployment Among Seniors over 65 years |
| Chileans | 85.6 /100 | #132 | Excellent 5.1% |
| Syrians | 85.3 /100 | #133 | Excellent 5.1% |
| Turks | 84.9 /100 | #134 | Excellent 5.1% |
| Ukrainians | 84.4 /100 | #135 | Excellent 5.1% |
| Whites/Caucasians | 84.4 /100 | #136 | Excellent 5.1% |
| Arabs | 84.3 /100 | #137 | Excellent 5.1% |
| New Zealanders | 83.2 /100 | #138 | Excellent 5.1% |
| Immigrants | Panama | 83.0 /100 | #139 | Excellent 5.1% |
| Immigrants | Chile | 83.0 /100 | #140 | Excellent 5.1% |
| Cherokee | 81.6 /100 | #141 | Excellent 5.1% |
| Immigrants | Indonesia | 81.0 /100 | #142 | Excellent 5.1% |
| Senegalese | 80.4 /100 | #143 | Excellent 5.1% |
| Poles | 80.3 /100 | #144 | Excellent 5.1% |
| Spanish | 78.8 /100 | #145 | Good 5.1% |
| Immigrants | Russia | 78.5 /100 | #146 | Good 5.1% |