Chilean vs Colombian Unemployment Among Youth under 25 years
COMPARE
Chilean
Colombian
Unemployment Among Youth under 25 years
Unemployment Among Youth under 25 years Comparison
Chileans
Colombians
11.3%
UNEMPLOYMENT AMONG YOUTH UNDER 25 YEARS
93.0/ 100
METRIC RATING
106th/ 347
METRIC RANK
11.9%
UNEMPLOYMENT AMONG YOUTH UNDER 25 YEARS
9.1/ 100
METRIC RATING
212th/ 347
METRIC RANK
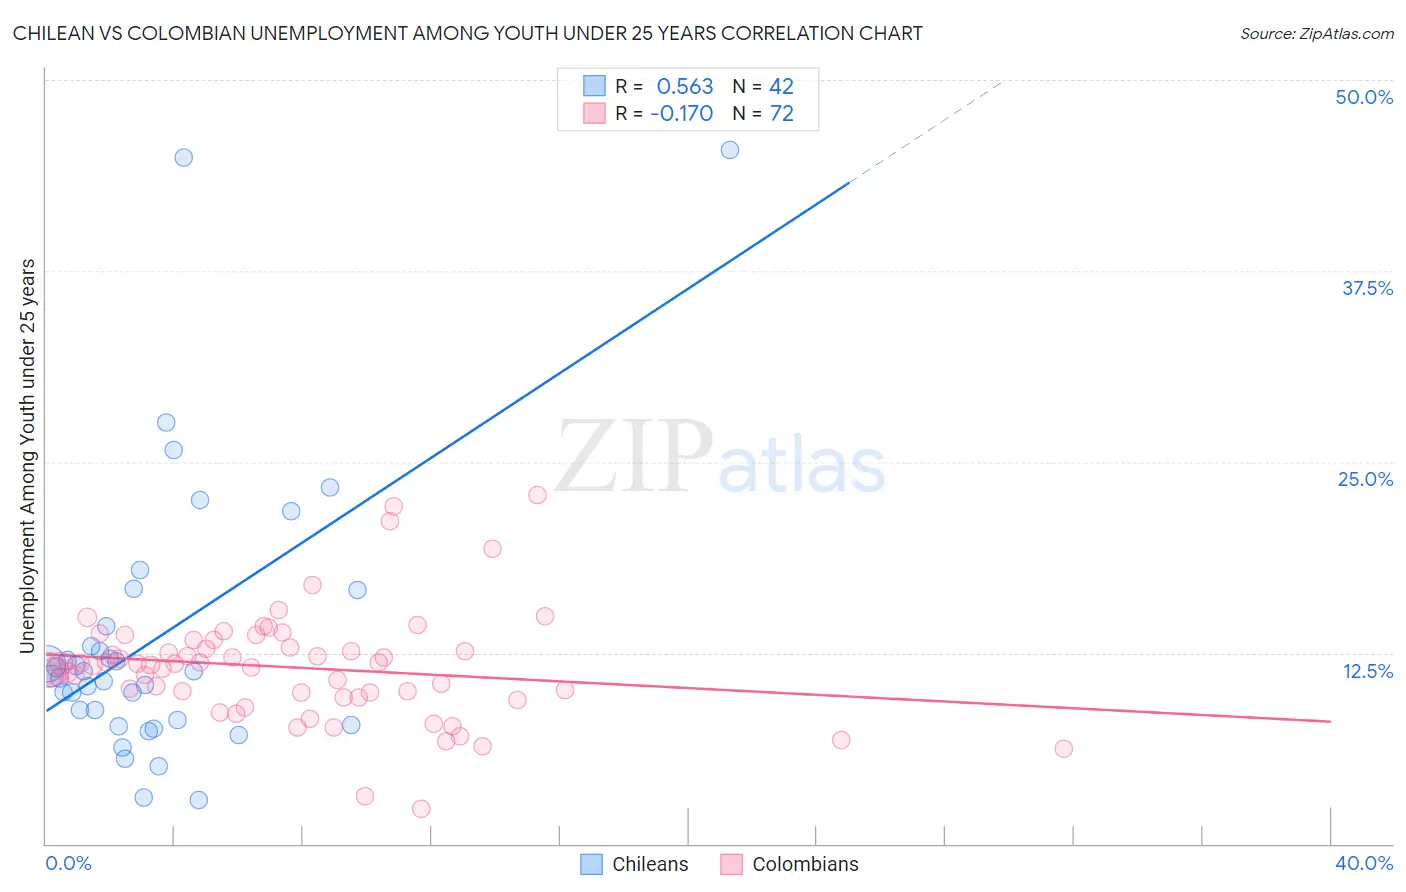
Chilean vs Colombian Unemployment Among Youth under 25 years Correlation Chart
The statistical analysis conducted on geographies consisting of 255,472,844 people shows a substantial positive correlation between the proportion of Chileans and unemployment rate among youth under the age of 25 in the United States with a correlation coefficient (R) of 0.563 and weighted average of 11.3%. Similarly, the statistical analysis conducted on geographies consisting of 414,681,795 people shows a poor negative correlation between the proportion of Colombians and unemployment rate among youth under the age of 25 in the United States with a correlation coefficient (R) of -0.170 and weighted average of 11.9%, a difference of 5.2%.
Unemployment Among Youth under 25 years Correlation Summary
| Measurement | Chilean | Colombian |
| Minimum | 2.9% | 2.3% |
| Maximum | 45.4% | 22.8% |
| Range | 42.5% | 20.5% |
| Mean | 13.4% | 11.5% |
| Median | 11.1% | 11.7% |
| Interquartile 25% (IQ1) | 8.1% | 9.7% |
| Interquartile 75% (IQ3) | 14.2% | 13.1% |
| Interquartile Range (IQR) | 6.1% | 3.4% |
| Standard Deviation (Sample) | 9.1% | 3.6% |
| Standard Deviation (Population) | 9.0% | 3.6% |
Similar Demographics by Unemployment Among Youth under 25 years
Demographics Similar to Chileans by Unemployment Among Youth under 25 years
In terms of unemployment among youth under 25 years, the demographic groups most similar to Chileans are Immigrants from Jordan (11.3%, a difference of 0.010%), Immigrants from Lithuania (11.3%, a difference of 0.020%), Immigrants from Kuwait (11.3%, a difference of 0.030%), Immigrants from Afghanistan (11.3%, a difference of 0.070%), and Immigrants from Thailand (11.3%, a difference of 0.090%).
| Demographics | Rating | Rank | Unemployment Among Youth under 25 years |
| Celtics | 94.0 /100 | #99 | Exceptional 11.3% |
| Pakistanis | 94.0 /100 | #100 | Exceptional 11.3% |
| Iroquois | 93.8 /100 | #101 | Exceptional 11.3% |
| Immigrants | Thailand | 93.6 /100 | #102 | Exceptional 11.3% |
| Immigrants | Malaysia | 93.6 /100 | #103 | Exceptional 11.3% |
| Immigrants | Afghanistan | 93.4 /100 | #104 | Exceptional 11.3% |
| Immigrants | Jordan | 93.1 /100 | #105 | Exceptional 11.3% |
| Chileans | 93.0 /100 | #106 | Exceptional 11.3% |
| Immigrants | Lithuania | 92.9 /100 | #107 | Exceptional 11.3% |
| Immigrants | Kuwait | 92.9 /100 | #108 | Exceptional 11.3% |
| Iranians | 92.0 /100 | #109 | Exceptional 11.3% |
| Immigrants | Norway | 91.5 /100 | #110 | Exceptional 11.3% |
| Immigrants | France | 90.3 /100 | #111 | Exceptional 11.3% |
| Immigrants | Austria | 90.3 /100 | #112 | Exceptional 11.3% |
| Fijians | 90.2 /100 | #113 | Exceptional 11.3% |
Demographics Similar to Colombians by Unemployment Among Youth under 25 years
In terms of unemployment among youth under 25 years, the demographic groups most similar to Colombians are Immigrants from Philippines (11.9%, a difference of 0.010%), South American (11.9%, a difference of 0.070%), Assyrian/Chaldean/Syriac (11.9%, a difference of 0.090%), Costa Rican (11.9%, a difference of 0.12%), and Samoan (11.9%, a difference of 0.23%).
| Demographics | Rating | Rank | Unemployment Among Youth under 25 years |
| Peruvians | 14.0 /100 | #205 | Poor 11.8% |
| Immigrants | Pakistan | 12.6 /100 | #206 | Poor 11.8% |
| Immigrants | Southern Europe | 12.3 /100 | #207 | Poor 11.8% |
| Comanche | 12.1 /100 | #208 | Poor 11.8% |
| Immigrants | Lebanon | 11.3 /100 | #209 | Poor 11.8% |
| Assyrians/Chaldeans/Syriacs | 9.8 /100 | #210 | Tragic 11.9% |
| Immigrants | Philippines | 9.2 /100 | #211 | Tragic 11.9% |
| Colombians | 9.1 /100 | #212 | Tragic 11.9% |
| South Americans | 8.5 /100 | #213 | Tragic 11.9% |
| Costa Ricans | 8.2 /100 | #214 | Tragic 11.9% |
| Samoans | 7.4 /100 | #215 | Tragic 11.9% |
| Guamanians/Chamorros | 7.0 /100 | #216 | Tragic 11.9% |
| Yaqui | 6.9 /100 | #217 | Tragic 11.9% |
| Immigrants | Middle Africa | 6.8 /100 | #218 | Tragic 11.9% |
| Immigrants | Nonimmigrants | 6.2 /100 | #219 | Tragic 11.9% |