Potawatomi vs Ugandan Unemployment Among Ages 30 to 34 years

COMPARE

Potawatomi
Race
Ancestry
AfghanAfricanAlaska NativeAlaskan AthabascanAlbanianAleutAlsatianAmericanApacheArabArapahoArgentineanArmenianAssyrian/Chaldean/SyriacAustralianAustrianBahamianBangladeshiBarbadianBasqueBelgianBelizeanBermudanBhutaneseBlackfeetBolivianBrazilianBritishBritish West IndianBulgarianBurmeseCajunCambodianCanadianCape VerdeanCarpatho RusynCelticCentral AmericanCentral American IndianCherokeeCheyenneChickasawChileanChineseChippewaChoctawColombianColvilleComancheCosta RicanCreeCreekCroatianCrowCubanCypriotCzechCzechoslovakianDanishDelawareDominicanDutchDutch West IndianEastern EuropeanEcuadorianEgyptianEnglishEstonianEthiopianEuropeanFijianFilipinoFinnishFrenchFrench American IndianFrench CanadianGermanGerman RussianGhanaianGreekGuamanian/ChamorroGuatemalanGuyaneseHaitianHmongHonduranHopiHoumaHungarianIcelanderIndian (Asian)IndonesianInupiatIranianIraqiIrishIroquoisIsraeliItalianJamaicanJapaneseJordanianKenyanKiowaKoreanLaotianLatvianLebaneseLiberianLithuanianLumbeeLuxembourgerMacedonianMalaysianMalteseMarshalleseMenomineeMexicanMexican American IndianMongolianMoroccanNative HawaiianNavajoNepaleseNew ZealanderNicaraguanNigerianNorthern EuropeanNorwegianOkinawanOsageOttawaPaiutePakistaniPalestinianPanamanianParaguayanPennsylvania GermanPeruvianPimaPolishPortuguesePotawatomiPuebloPuerto RicanPuget Sound SalishRomanianRussianSalvadoranSamoanScandinavianScotch-IrishScottishSeminoleSenegaleseSerbianShoshoneSierra LeoneanSiouxSlavicSlovakSloveneSomaliSouth AfricanSouth AmericanSouth American IndianSoviet UnionSpaniardSpanishSpanish AmericanSpanish American IndianSri LankanSubsaharan AfricanSudaneseSwedishSwissSyrianTaiwaneseThaiTlingit-HaidaTohono O'OdhamTonganTrinidadian and TobagonianTsimshianTurkishU.S. Virgin IslanderUkrainianUruguayanUteVenezuelanVietnameseWelshWest IndianYakamaYaquiYugoslavianYumanYup'ikZimbabwean
Immigration
NonimmigrantsImmigrantsAfghanistanAfricaAlbaniaArgentinaArmeniaAsiaAustraliaAustriaBahamasBangladeshBarbadosBelarusBelgiumBelizeBoliviaBosnia and HerzegovinaBrazilBulgariaBurma/MyanmarCabo VerdeCambodiaCameroonCanadaCaribbeanCentral AmericaChileChinaColombiaCongoCosta RicaCroatiaCubaCzechoslovakiaDenmarkDominicaDominican RepublicEastern AfricaEastern AsiaEastern EuropeEcuadorEgyptEl SalvadorEnglandEritreaEthiopiaEuropeFijiFranceGermanyGhanaGreeceGrenadaGuatemalaGuyanaHaitiHondurasHong KongHungaryIndiaIndonesiaIranIraqIrelandIsraelItalyJamaicaJapanJordanKazakhstanKenyaKoreaKuwaitLaosLatin AmericaLatviaLebanonLiberiaLithuaniaMalaysiaMexicoMicronesiaMiddle AfricaMoldovaMoroccoNepalNetherlandsNicaraguaNigeriaNorth AmericaNorth MacedoniaNorthern AfricaNorthern EuropeNorwayOceaniaPakistanPanamaPeruPhilippinesPolandPortugalRomaniaRussiaSaudi ArabiaScotlandSenegalSerbiaSierra LeoneSingaporeSomaliaSouth AfricaSouth AmericaSouth Central AsiaSouth Eastern AsiaSouthern EuropeSpainSri LankaSt. Vincent and the GrenadinesSudanSwedenSwitzerlandSyriaTaiwanThailandTrinidad and TobagoTurkeyUgandaUkraineUruguayUzbekistanVenezuelaVietnamWest IndiesWestern AfricaWestern AsiaWestern EuropeYemenZaireZimbabweAzores
Ugandan
Race
Ancestry
AfghanAfricanAlaska NativeAlaskan AthabascanAlbanianAleutAlsatianAmericanApacheArabArapahoArgentineanArmenianAssyrian/Chaldean/SyriacAustralianAustrianBahamianBangladeshiBarbadianBasqueBelgianBelizeanBermudanBhutaneseBlackfeetBolivianBrazilianBritishBritish West IndianBulgarianBurmeseCajunCambodianCanadianCape VerdeanCarpatho RusynCelticCentral AmericanCentral American IndianCherokeeCheyenneChickasawChileanChineseChippewaChoctawColombianColvilleComancheCosta RicanCreeCreekCroatianCrowCubanCypriotCzechCzechoslovakianDanishDelawareDominicanDutchDutch West IndianEastern EuropeanEcuadorianEgyptianEnglishEstonianEthiopianEuropeanFijianFilipinoFinnishFrenchFrench American IndianFrench CanadianGermanGerman RussianGhanaianGreekGuamanian/ChamorroGuatemalanGuyaneseHaitianHmongHonduranHopiHoumaHungarianIcelanderIndian (Asian)IndonesianInupiatIranianIraqiIrishIroquoisIsraeliItalianJamaicanJapaneseJordanianKenyanKiowaKoreanLaotianLatvianLebaneseLiberianLithuanianLumbeeLuxembourgerMacedonianMalaysianMalteseMarshalleseMenomineeMexicanMexican American IndianMongolianMoroccanNative HawaiianNavajoNepaleseNew ZealanderNicaraguanNigerianNorthern EuropeanNorwegianOkinawanOsageOttawaPaiutePakistaniPalestinianPanamanianParaguayanPennsylvania GermanPeruvianPimaPolishPortuguesePuebloPuerto RicanPuget Sound SalishRomanianRussianSalvadoranSamoanScandinavianScotch-IrishScottishSeminoleSenegaleseSerbianShoshoneSierra LeoneanSiouxSlavicSlovakSloveneSomaliSouth AfricanSouth AmericanSouth American IndianSoviet UnionSpaniardSpanishSpanish AmericanSpanish American IndianSri LankanSubsaharan AfricanSudaneseSwedishSwissSyrianTaiwaneseThaiTlingit-HaidaTohono O'OdhamTonganTrinidadian and TobagonianTsimshianTurkishU.S. Virgin IslanderUgandanUkrainianUruguayanUteVenezuelanVietnameseWelshWest IndianYakamaYaquiYugoslavianYumanYup'ikZimbabwean
Immigration
NonimmigrantsImmigrantsAfghanistanAfricaAlbaniaArgentinaArmeniaAsiaAustraliaAustriaBahamasBangladeshBarbadosBelarusBelgiumBelizeBoliviaBosnia and HerzegovinaBrazilBulgariaBurma/MyanmarCabo VerdeCambodiaCameroonCanadaCaribbeanCentral AmericaChileChinaColombiaCongoCosta RicaCroatiaCubaCzechoslovakiaDenmarkDominicaDominican RepublicEastern AfricaEastern AsiaEastern EuropeEcuadorEgyptEl SalvadorEnglandEritreaEthiopiaEuropeFijiFranceGermanyGhanaGreeceGrenadaGuatemalaGuyanaHaitiHondurasHong KongHungaryIndiaIndonesiaIranIraqIrelandIsraelItalyJamaicaJapanJordanKazakhstanKenyaKoreaKuwaitLaosLatin AmericaLatviaLebanonLiberiaLithuaniaMalaysiaMexicoMicronesiaMiddle AfricaMoldovaMoroccoNepalNetherlandsNicaraguaNigeriaNorth AmericaNorth MacedoniaNorthern AfricaNorthern EuropeNorwayOceaniaPakistanPanamaPeruPhilippinesPolandPortugalRomaniaRussiaSaudi ArabiaScotlandSenegalSerbiaSierra LeoneSingaporeSomaliaSouth AfricaSouth AmericaSouth Central AsiaSouth Eastern AsiaSouthern EuropeSpainSri LankaSt. Vincent and the GrenadinesSudanSwedenSwitzerlandSyriaTaiwanThailandTrinidad and TobagoTurkeyUgandaUkraineUruguayUzbekistanVenezuelaVietnamWest IndiesWestern AfricaWestern AsiaWestern EuropeYemenZaireZimbabweAzores
Unemployment Among Ages 30 to 34 years
Income
Poverty
Unemployment
Labor Participation
Family Structure
Vehicle Availability
Education Level
Disability

Unemployment Among Ages 30 to 34 years Comparison

Potawatomi

Ugandans

Tragic
Exceptional
6.0%
UNEMPLOYMENT AMONG AGES 30 TO 34 YEARS
0.2/ 100
METRIC RATING
252nd/ 347
METRIC RANK
4.9%
UNEMPLOYMENT AMONG AGES 30 TO 34 YEARS
99.7/ 100
METRIC RATING
24th/ 347
METRIC RANK

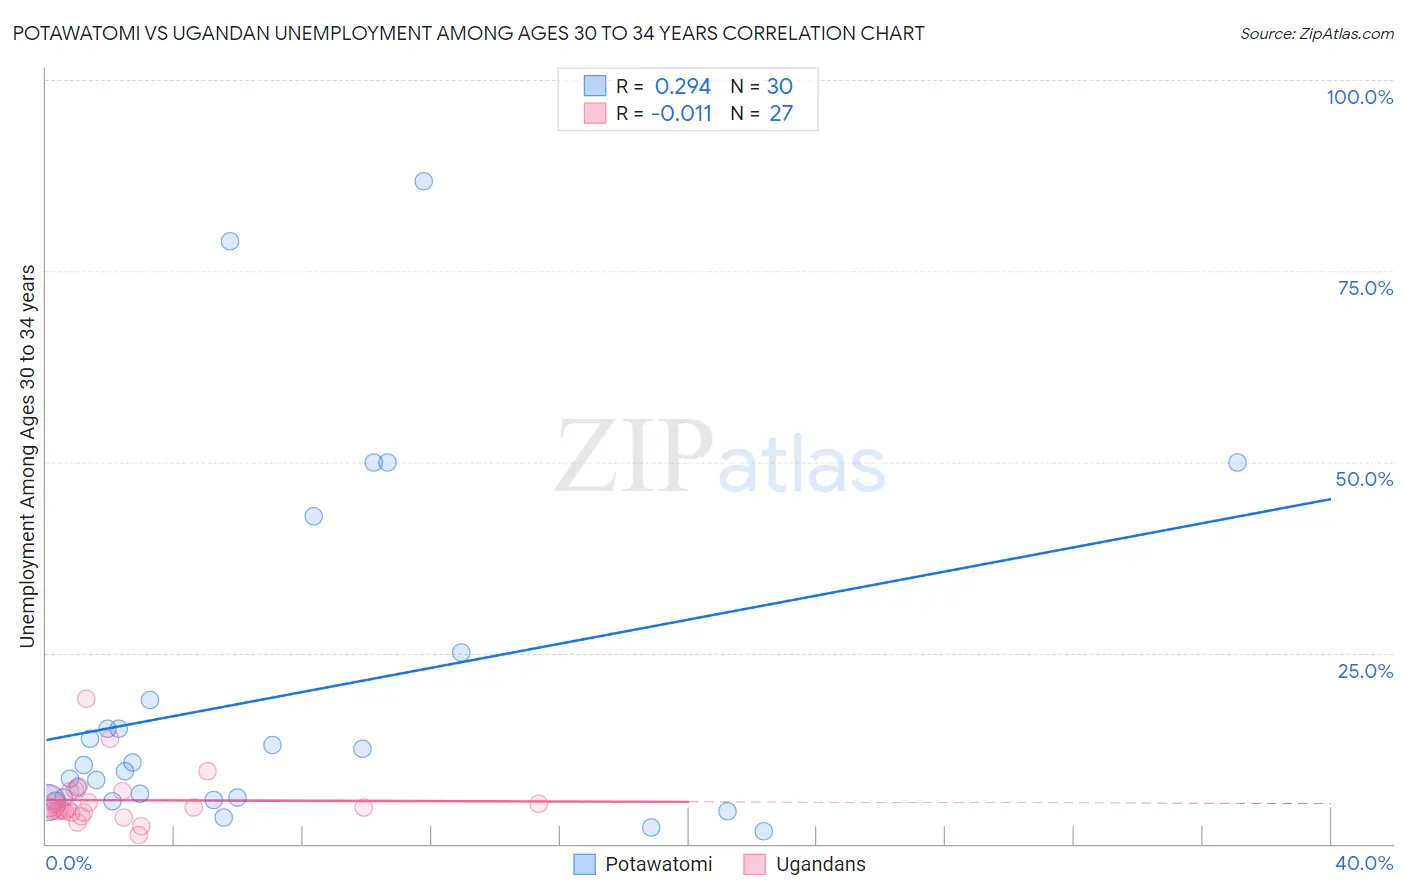
Potawatomi vs Ugandan Unemployment Among Ages 30 to 34 years Correlation Chart

The statistical analysis conducted on geographies consisting of 114,286,422 people shows a weak positive correlation between the proportion of Potawatomi and unemployment rate among population between the ages 30 and 34 in the United States with a correlation coefficient (R) of 0.294 and weighted average of 6.0%. Similarly, the statistical analysis conducted on geographies consisting of 92,893,290 people shows no correlation between the proportion of Ugandans and unemployment rate among population between the ages 30 and 34 in the United States with a correlation coefficient (R) of -0.011 and weighted average of 4.9%, a difference of 22.9%.
Potawatomi vs Ugandan Unemployment Among Ages 30 to 34 years

Unemployment Among Ages 30 to 34 years Correlation Summary

MeasurementPotawatomiUgandan
Minimum1.6%1.1%
Maximum86.7%19.0%
Range85.1%17.9%
Mean19.3%5.7%
Median9.9%4.7%
Interquartile 25% (IQ1)5.7%4.2%
Interquartile 75% (IQ3)18.8%6.8%
Interquartile Range (IQR)13.1%2.6%
Standard Deviation (Sample)22.5%3.6%
Standard Deviation (Population)22.1%3.5%

Similar Demographics by Unemployment Among Ages 30 to 34 years

Demographics Similar to Potawatomi by Unemployment Among Ages 30 to 34 years

In terms of unemployment among ages 30 to 34 years, the demographic groups most similar to Potawatomi are Tlingit-Haida (6.0%, a difference of 0.020%), Immigrants from Honduras (6.0%, a difference of 0.21%), Honduran (6.0%, a difference of 0.30%), Nigerian (6.0%, a difference of 0.31%), and Immigrants from Guatemala (6.0%, a difference of 0.31%).
DemographicsRating | RankUnemployment Among Ages 30 to 34 years
Sub-Saharan Africans
0.3
/100
|
#245
Tragic
6.0%
Ghanaians
0.3
/100
|
#246
Tragic
6.0%
Nigerians
0.3
/100
|
#247
Tragic
6.0%
Immigrants | Guatemala
0.3
/100
|
#248
Tragic
6.0%
Hondurans
0.3
/100
|
#249
Tragic
6.0%
Immigrants | Honduras
0.3
/100
|
#250
Tragic
6.0%
Tlingit-Haida
0.2
/100
|
#251
Tragic
6.0%
Potawatomi
0.2
/100
|
#252
Tragic
6.0%
Immigrants | Nonimmigrants
0.2
/100
|
#253
Tragic
6.1%
Armenians
0.1
/100
|
#254
Tragic
6.1%
Immigrants | Portugal
0.1
/100
|
#255
Tragic
6.1%
Immigrants | Ghana
0.1
/100
|
#256
Tragic
6.1%
Immigrants | Sierra Leone
0.1
/100
|
#257
Tragic
6.1%
Mexicans
0.1
/100
|
#258
Tragic
6.1%
Haitians
0.1
/100
|
#259
Tragic
6.1%

Demographics Similar to Ugandans by Unemployment Among Ages 30 to 34 years

In terms of unemployment among ages 30 to 34 years, the demographic groups most similar to Ugandans are Hmong (4.9%, a difference of 0.55%), Immigrants from South Central Asia (4.9%, a difference of 0.73%), Immigrants from Singapore (5.0%, a difference of 0.92%), Ethiopian (4.9%, a difference of 0.94%), and Immigrants from Taiwan (4.9%, a difference of 0.95%).
DemographicsRating | RankUnemployment Among Ages 30 to 34 years
Immigrants | Bulgaria
99.9
/100
|
#17
Exceptional
4.8%
Bolivians
99.8
/100
|
#18
Exceptional
4.9%
Immigrants | Sudan
99.8
/100
|
#19
Exceptional
4.9%
Immigrants | Taiwan
99.8
/100
|
#20
Exceptional
4.9%
Ethiopians
99.8
/100
|
#21
Exceptional
4.9%
Immigrants | South Central Asia
99.8
/100
|
#22
Exceptional
4.9%
Hmong
99.8
/100
|
#23
Exceptional
4.9%
Ugandans
99.7
/100
|
#24
Exceptional
4.9%
Immigrants | Singapore
99.5
/100
|
#25
Exceptional
5.0%
Immigrants | Kuwait
99.5
/100
|
#26
Exceptional
5.0%
Danes
99.5
/100
|
#27
Exceptional
5.0%
Immigrants | Cuba
99.4
/100
|
#28
Exceptional
5.0%
German Russians
99.4
/100
|
#29
Exceptional
5.0%
Norwegians
99.4
/100
|
#30
Exceptional
5.0%
Somalis
99.3
/100
|
#31
Exceptional
5.0%