Czechoslovakian vs Austrian Unemployment Among Women with Children Under 18 years
COMPARE
Czechoslovakian
Austrian
Unemployment Among Women with Children Under 18 years
Unemployment Among Women with Children Under 18 years Comparison
Czechoslovakians
Austrians
5.1%
UNEMPLOYMENT AMONG WOMEN WITH CHILDREN UNDER 18 YEARS
98.0/ 100
METRIC RATING
57th/ 347
METRIC RANK
5.1%
UNEMPLOYMENT AMONG WOMEN WITH CHILDREN UNDER 18 YEARS
96.6/ 100
METRIC RATING
69th/ 347
METRIC RANK
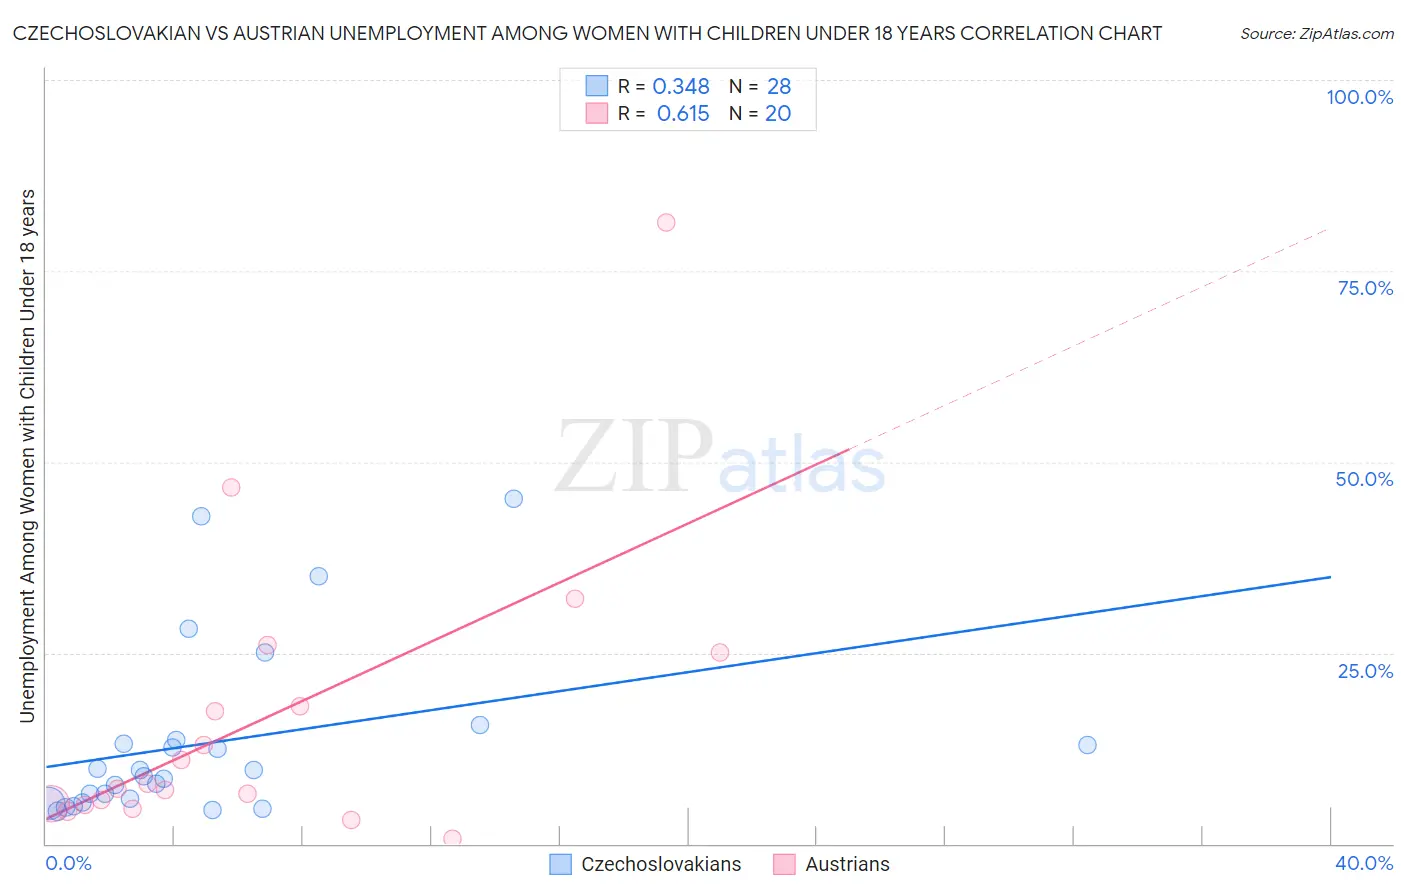
Czechoslovakian vs Austrian Unemployment Among Women with Children Under 18 years Correlation Chart
The statistical analysis conducted on geographies consisting of 349,944,038 people shows a mild positive correlation between the proportion of Czechoslovakians and unemployment rate among women with children under the age of 18 in the United States with a correlation coefficient (R) of 0.348 and weighted average of 5.1%. Similarly, the statistical analysis conducted on geographies consisting of 424,667,756 people shows a significant positive correlation between the proportion of Austrians and unemployment rate among women with children under the age of 18 in the United States with a correlation coefficient (R) of 0.615 and weighted average of 5.1%, a difference of 1.0%.
Unemployment Among Women with Children Under 18 years Correlation Summary
| Measurement | Czechoslovakian | Austrian |
| Minimum | 4.3% | 0.60% |
| Maximum | 45.2% | 81.3% |
| Range | 40.9% | 80.7% |
| Mean | 13.3% | 16.4% |
| Median | 9.3% | 7.5% |
| Interquartile 25% (IQ1) | 5.7% | 5.2% |
| Interquartile 75% (IQ3) | 13.3% | 21.5% |
| Interquartile Range (IQR) | 7.6% | 16.3% |
| Standard Deviation (Sample) | 11.4% | 19.2% |
| Standard Deviation (Population) | 11.2% | 18.7% |
Demographics Similar to Czechoslovakians and Austrians by Unemployment Among Women with Children Under 18 years
In terms of unemployment among women with children under 18 years, the demographic groups most similar to Czechoslovakians are Immigrants from Ireland (5.1%, a difference of 0.050%), Immigrants from Belgium (5.1%, a difference of 0.080%), Immigrants from Sri Lanka (5.1%, a difference of 0.090%), Asian (5.1%, a difference of 0.10%), and Immigrants from Serbia (5.1%, a difference of 0.23%). Similarly, the demographic groups most similar to Austrians are Icelander (5.1%, a difference of 0.0%), Serbian (5.1%, a difference of 0.040%), Irish (5.1%, a difference of 0.14%), Fijian (5.1%, a difference of 0.23%), and Immigrants from Australia (5.1%, a difference of 0.25%).
| Demographics | Rating | Rank | Unemployment Among Women with Children Under 18 years |
| Scottish | 98.2 /100 | #53 | Exceptional 5.1% |
| Immigrants | Serbia | 98.2 /100 | #54 | Exceptional 5.1% |
| Immigrants | Sri Lanka | 98.1 /100 | #55 | Exceptional 5.1% |
| Immigrants | Ireland | 98.0 /100 | #56 | Exceptional 5.1% |
| Czechoslovakians | 98.0 /100 | #57 | Exceptional 5.1% |
| Immigrants | Belgium | 97.9 /100 | #58 | Exceptional 5.1% |
| Asians | 97.9 /100 | #59 | Exceptional 5.1% |
| Welsh | 97.7 /100 | #60 | Exceptional 5.1% |
| Russians | 97.5 /100 | #61 | Exceptional 5.1% |
| Immigrants | Bulgaria | 97.4 /100 | #62 | Exceptional 5.1% |
| Italians | 97.4 /100 | #63 | Exceptional 5.1% |
| Estonians | 97.2 /100 | #64 | Exceptional 5.1% |
| Immigrants | Sweden | 97.1 /100 | #65 | Exceptional 5.1% |
| Immigrants | Australia | 97.0 /100 | #66 | Exceptional 5.1% |
| Fijians | 96.9 /100 | #67 | Exceptional 5.1% |
| Irish | 96.8 /100 | #68 | Exceptional 5.1% |
| Austrians | 96.6 /100 | #69 | Exceptional 5.1% |
| Icelanders | 96.6 /100 | #70 | Exceptional 5.1% |
| Serbians | 96.5 /100 | #71 | Exceptional 5.1% |
| Immigrants | Bolivia | 96.1 /100 | #72 | Exceptional 5.1% |
| Albanians | 95.9 /100 | #73 | Exceptional 5.1% |