Immigrants from Norway vs Iroquois Unemployment Among Ages 60 to 64 years
COMPARE
Immigrants from Norway
Iroquois
Unemployment Among Ages 60 to 64 years
Unemployment Among Ages 60 to 64 years Comparison
Immigrants from Norway
Iroquois
4.8%
UNEMPLOYMENT AMONG AGES 60 TO 64 YEARS
65.1/ 100
METRIC RATING
161st/ 347
METRIC RANK
4.7%
UNEMPLOYMENT AMONG AGES 60 TO 64 YEARS
99.1/ 100
METRIC RATING
81st/ 347
METRIC RANK
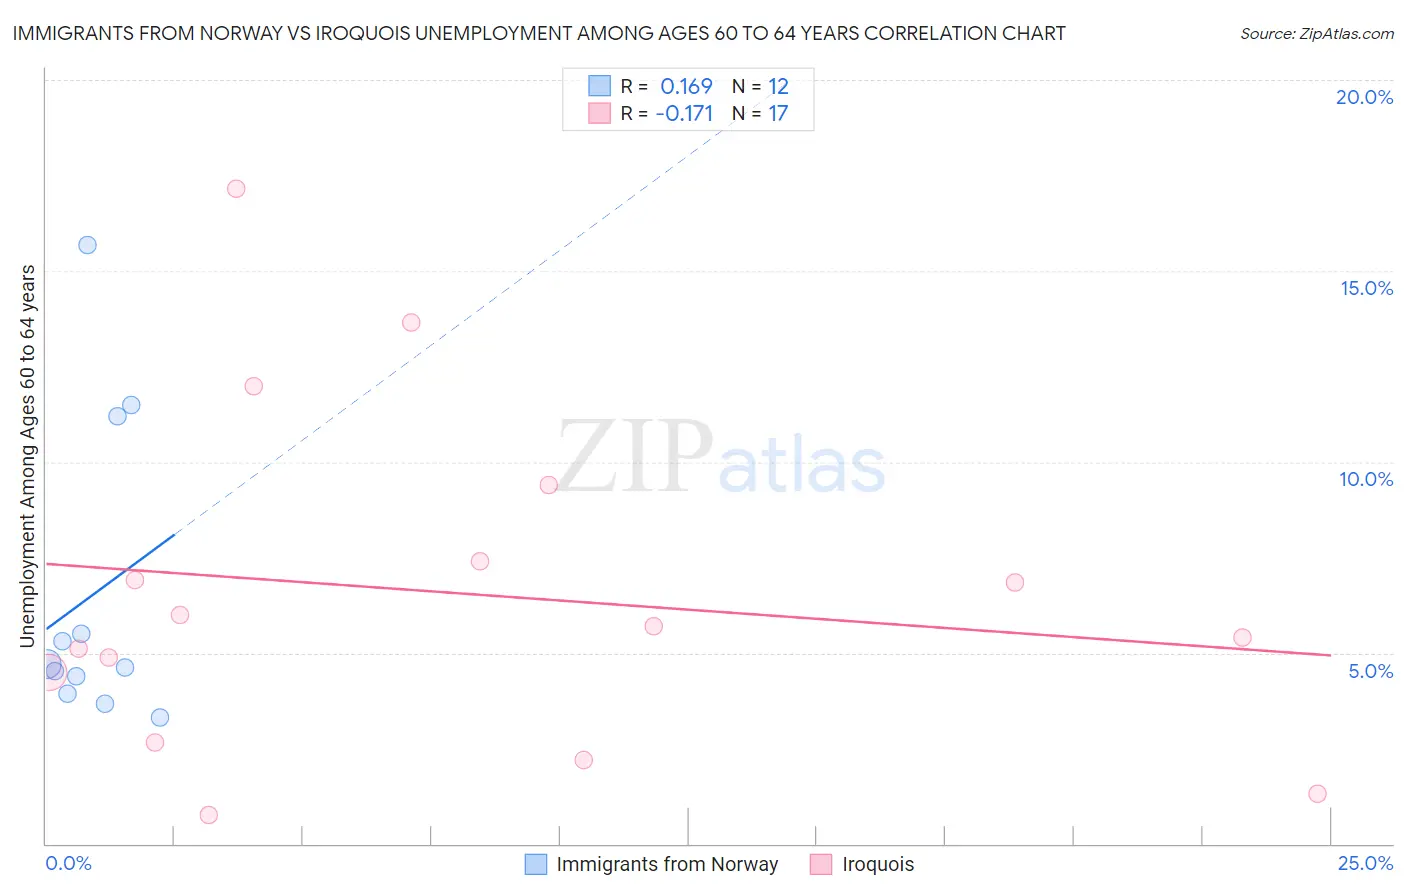
Immigrants from Norway vs Iroquois Unemployment Among Ages 60 to 64 years Correlation Chart
The statistical analysis conducted on geographies consisting of 111,900,963 people shows a poor positive correlation between the proportion of Immigrants from Norway and unemployment rate among population between the ages 60 and 64 in the United States with a correlation coefficient (R) of 0.169 and weighted average of 4.8%. Similarly, the statistical analysis conducted on geographies consisting of 192,997,204 people shows a poor negative correlation between the proportion of Iroquois and unemployment rate among population between the ages 60 and 64 in the United States with a correlation coefficient (R) of -0.171 and weighted average of 4.7%, a difference of 3.8%.
Unemployment Among Ages 60 to 64 years Correlation Summary
| Measurement | Immigrants from Norway | Iroquois |
| Minimum | 3.3% | 0.76% |
| Maximum | 15.7% | 17.1% |
| Range | 12.4% | 16.4% |
| Mean | 6.5% | 6.6% |
| Median | 4.7% | 5.7% |
| Interquartile 25% (IQ1) | 4.2% | 3.6% |
| Interquartile 75% (IQ3) | 8.3% | 8.4% |
| Interquartile Range (IQR) | 4.2% | 4.8% |
| Standard Deviation (Sample) | 4.0% | 4.4% |
| Standard Deviation (Population) | 3.8% | 4.3% |
Similar Demographics by Unemployment Among Ages 60 to 64 years
Demographics Similar to Immigrants from Norway by Unemployment Among Ages 60 to 64 years
In terms of unemployment among ages 60 to 64 years, the demographic groups most similar to Immigrants from Norway are South African (4.8%, a difference of 0.0%), Australian (4.8%, a difference of 0.010%), Immigrants from Belgium (4.8%, a difference of 0.010%), Spanish (4.8%, a difference of 0.020%), and Pakistani (4.8%, a difference of 0.020%).
| Demographics | Rating | Rank | Unemployment Among Ages 60 to 64 years |
| Chileans | 72.6 /100 | #154 | Good 4.8% |
| Filipinos | 72.1 /100 | #155 | Good 4.8% |
| Immigrants | Bolivia | 69.2 /100 | #156 | Good 4.8% |
| Laotians | 66.8 /100 | #157 | Good 4.8% |
| Immigrants | Taiwan | 66.0 /100 | #158 | Good 4.8% |
| Spanish | 65.5 /100 | #159 | Good 4.8% |
| Australians | 65.3 /100 | #160 | Good 4.8% |
| Immigrants | Norway | 65.1 /100 | #161 | Good 4.8% |
| South Africans | 65.1 /100 | #162 | Good 4.8% |
| Immigrants | Belgium | 64.8 /100 | #163 | Good 4.8% |
| Pakistanis | 64.6 /100 | #164 | Good 4.8% |
| Immigrants | Panama | 62.0 /100 | #165 | Good 4.8% |
| Palestinians | 60.5 /100 | #166 | Good 4.8% |
| Immigrants | Northern Europe | 59.1 /100 | #167 | Average 4.8% |
| Immigrants | Southern Europe | 56.7 /100 | #168 | Average 4.8% |
Demographics Similar to Iroquois by Unemployment Among Ages 60 to 64 years
In terms of unemployment among ages 60 to 64 years, the demographic groups most similar to Iroquois are Okinawan (4.7%, a difference of 0.0%), Icelander (4.7%, a difference of 0.010%), Immigrants from Egypt (4.7%, a difference of 0.010%), Irish (4.7%, a difference of 0.040%), and Seminole (4.7%, a difference of 0.070%).
| Demographics | Rating | Rank | Unemployment Among Ages 60 to 64 years |
| Northern Europeans | 99.3 /100 | #74 | Exceptional 4.6% |
| Potawatomi | 99.3 /100 | #75 | Exceptional 4.6% |
| Slovaks | 99.3 /100 | #76 | Exceptional 4.6% |
| Immigrants | Somalia | 99.2 /100 | #77 | Exceptional 4.6% |
| Seminole | 99.2 /100 | #78 | Exceptional 4.7% |
| Irish | 99.2 /100 | #79 | Exceptional 4.7% |
| Icelanders | 99.1 /100 | #80 | Exceptional 4.7% |
| Iroquois | 99.1 /100 | #81 | Exceptional 4.7% |
| Okinawans | 99.1 /100 | #82 | Exceptional 4.7% |
| Immigrants | Egypt | 99.1 /100 | #83 | Exceptional 4.7% |
| Thais | 98.9 /100 | #84 | Exceptional 4.7% |
| Immigrants | Sri Lanka | 98.9 /100 | #85 | Exceptional 4.7% |
| Immigrants | Oceania | 98.9 /100 | #86 | Exceptional 4.7% |
| Immigrants | Jordan | 98.8 /100 | #87 | Exceptional 4.7% |
| Immigrants | Bulgaria | 98.7 /100 | #88 | Exceptional 4.7% |