Portuguese vs Cherokee Unemployment Among Seniors over 75 years
COMPARE
Portuguese
Cherokee
Unemployment Among Seniors over 75 years
Unemployment Among Seniors over 75 years Comparison
Portuguese
Cherokee
10.4%
UNEMPLOYMENT AMONG SENIORS OVER 75 YEARS
0.0/ 100
METRIC RATING
325th/ 347
METRIC RANK
9.8%
UNEMPLOYMENT AMONG SENIORS OVER 75 YEARS
0.0/ 100
METRIC RATING
297th/ 347
METRIC RANK
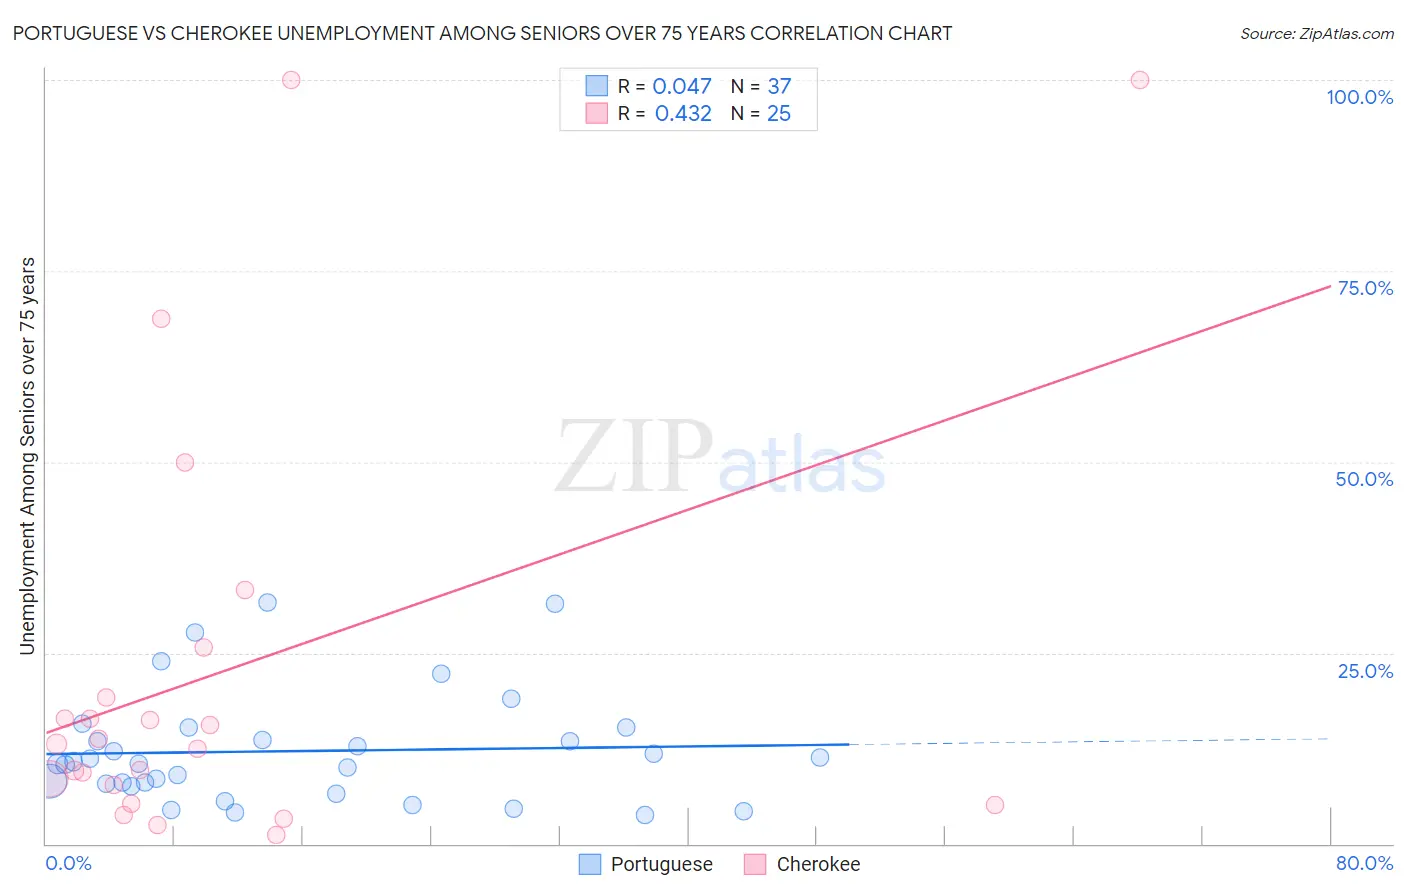
Portuguese vs Cherokee Unemployment Among Seniors over 75 years Correlation Chart
The statistical analysis conducted on geographies consisting of 216,681,977 people shows no correlation between the proportion of Portuguese and unemployment rate among seniors over the age of 75 in the United States with a correlation coefficient (R) of 0.047 and weighted average of 10.4%. Similarly, the statistical analysis conducted on geographies consisting of 219,338,381 people shows a moderate positive correlation between the proportion of Cherokee and unemployment rate among seniors over the age of 75 in the United States with a correlation coefficient (R) of 0.432 and weighted average of 9.8%, a difference of 5.7%.
Unemployment Among Seniors over 75 years Correlation Summary
| Measurement | Portuguese | Cherokee |
| Minimum | 3.7% | 1.2% |
| Maximum | 31.5% | 100.0% |
| Range | 27.8% | 98.8% |
| Mean | 12.1% | 22.7% |
| Median | 10.4% | 13.1% |
| Interquartile 25% (IQ1) | 7.7% | 6.5% |
| Interquartile 75% (IQ3) | 14.4% | 22.4% |
| Interquartile Range (IQR) | 6.7% | 15.9% |
| Standard Deviation (Sample) | 7.2% | 27.8% |
| Standard Deviation (Population) | 7.1% | 27.3% |
Similar Demographics by Unemployment Among Seniors over 75 years
Demographics Similar to Portuguese by Unemployment Among Seniors over 75 years
In terms of unemployment among seniors over 75 years, the demographic groups most similar to Portuguese are American (10.4%, a difference of 0.20%), Tongan (10.4%, a difference of 0.23%), Slovak (10.4%, a difference of 0.23%), Dutch (10.4%, a difference of 0.31%), and Polish (10.3%, a difference of 0.87%).
| Demographics | Rating | Rank | Unemployment Among Seniors over 75 years |
| Liberians | 0.0 /100 | #318 | Tragic 10.2% |
| Germans | 0.0 /100 | #319 | Tragic 10.3% |
| French | 0.0 /100 | #320 | Tragic 10.3% |
| Aleuts | 0.0 /100 | #321 | Tragic 10.3% |
| Poles | 0.0 /100 | #322 | Tragic 10.3% |
| Tongans | 0.0 /100 | #323 | Tragic 10.4% |
| Americans | 0.0 /100 | #324 | Tragic 10.4% |
| Portuguese | 0.0 /100 | #325 | Tragic 10.4% |
| Slovaks | 0.0 /100 | #326 | Tragic 10.4% |
| Dutch | 0.0 /100 | #327 | Tragic 10.4% |
| Immigrants | Portugal | 0.0 /100 | #328 | Tragic 10.5% |
| Tsimshian | 0.0 /100 | #329 | Tragic 10.5% |
| Immigrants | Azores | 0.0 /100 | #330 | Tragic 10.7% |
| Tohono O'odham | 0.0 /100 | #331 | Tragic 10.8% |
| Immigrants | Liberia | 0.0 /100 | #332 | Tragic 10.9% |
Demographics Similar to Cherokee by Unemployment Among Seniors over 75 years
In terms of unemployment among seniors over 75 years, the demographic groups most similar to Cherokee are Immigrants from St. Vincent and the Grenadines (9.8%, a difference of 0.080%), Nonimmigrants (9.8%, a difference of 0.13%), Lithuanian (9.9%, a difference of 0.38%), Immigrants from Dominica (9.8%, a difference of 0.50%), and Norwegian (9.8%, a difference of 0.56%).
| Demographics | Rating | Rank | Unemployment Among Seniors over 75 years |
| Sioux | 0.0 /100 | #290 | Tragic 9.7% |
| Scandinavians | 0.0 /100 | #291 | Tragic 9.7% |
| Immigrants | Western Africa | 0.0 /100 | #292 | Tragic 9.8% |
| Norwegians | 0.0 /100 | #293 | Tragic 9.8% |
| Immigrants | Dominica | 0.0 /100 | #294 | Tragic 9.8% |
| Immigrants | Nonimmigrants | 0.0 /100 | #295 | Tragic 9.8% |
| Immigrants | St. Vincent and the Grenadines | 0.0 /100 | #296 | Tragic 9.8% |
| Cherokee | 0.0 /100 | #297 | Tragic 9.8% |
| Lithuanians | 0.0 /100 | #298 | Tragic 9.9% |
| Belgians | 0.0 /100 | #299 | Tragic 9.9% |
| Iraqis | 0.0 /100 | #300 | Tragic 9.9% |
| Welsh | 0.0 /100 | #301 | Tragic 10.0% |
| Finns | 0.0 /100 | #302 | Tragic 10.0% |
| Puget Sound Salish | 0.0 /100 | #303 | Tragic 10.0% |
| Scotch-Irish | 0.0 /100 | #304 | Tragic 10.0% |