Jordanian vs Cherokee Unemployment Among Seniors over 75 years
COMPARE
Jordanian
Cherokee
Unemployment Among Seniors over 75 years
Unemployment Among Seniors over 75 years Comparison
Jordanians
Cherokee
9.1%
UNEMPLOYMENT AMONG SENIORS OVER 75 YEARS
4.0/ 100
METRIC RATING
236th/ 347
METRIC RANK
9.8%
UNEMPLOYMENT AMONG SENIORS OVER 75 YEARS
0.0/ 100
METRIC RATING
297th/ 347
METRIC RANK
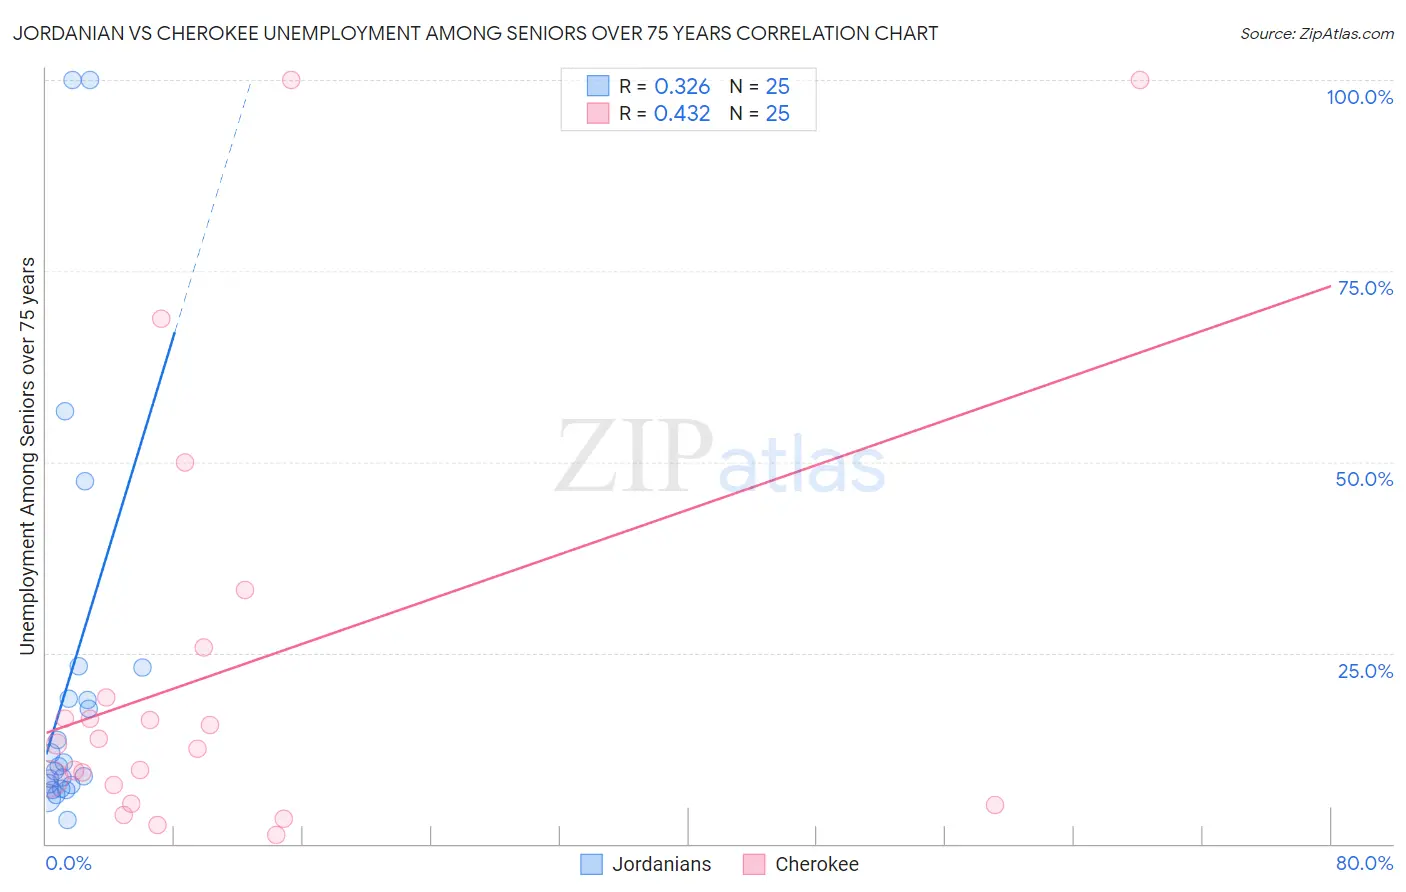
Jordanian vs Cherokee Unemployment Among Seniors over 75 years Correlation Chart
The statistical analysis conducted on geographies consisting of 115,202,173 people shows a mild positive correlation between the proportion of Jordanians and unemployment rate among seniors over the age of 75 in the United States with a correlation coefficient (R) of 0.326 and weighted average of 9.1%. Similarly, the statistical analysis conducted on geographies consisting of 219,338,381 people shows a moderate positive correlation between the proportion of Cherokee and unemployment rate among seniors over the age of 75 in the United States with a correlation coefficient (R) of 0.432 and weighted average of 9.8%, a difference of 8.0%.
Unemployment Among Seniors over 75 years Correlation Summary
| Measurement | Jordanian | Cherokee |
| Minimum | 3.1% | 1.2% |
| Maximum | 100.0% | 100.0% |
| Range | 96.9% | 98.8% |
| Mean | 21.6% | 22.7% |
| Median | 10.1% | 13.1% |
| Interquartile 25% (IQ1) | 7.4% | 6.5% |
| Interquartile 75% (IQ3) | 21.1% | 22.4% |
| Interquartile Range (IQR) | 13.7% | 15.9% |
| Standard Deviation (Sample) | 26.7% | 27.8% |
| Standard Deviation (Population) | 26.2% | 27.3% |
Similar Demographics by Unemployment Among Seniors over 75 years
Demographics Similar to Jordanians by Unemployment Among Seniors over 75 years
In terms of unemployment among seniors over 75 years, the demographic groups most similar to Jordanians are Panamanian (9.1%, a difference of 0.010%), Houma (9.1%, a difference of 0.030%), Inupiat (9.1%, a difference of 0.13%), Mexican (9.1%, a difference of 0.19%), and Vietnamese (9.1%, a difference of 0.20%).
| Demographics | Rating | Rank | Unemployment Among Seniors over 75 years |
| Hispanics or Latinos | 5.0 /100 | #229 | Tragic 9.1% |
| Northern Europeans | 4.9 /100 | #230 | Tragic 9.1% |
| Immigrants | Central America | 4.9 /100 | #231 | Tragic 9.1% |
| Africans | 4.9 /100 | #232 | Tragic 9.1% |
| Yugoslavians | 4.8 /100 | #233 | Tragic 9.1% |
| Vietnamese | 4.6 /100 | #234 | Tragic 9.1% |
| Panamanians | 4.0 /100 | #235 | Tragic 9.1% |
| Jordanians | 4.0 /100 | #236 | Tragic 9.1% |
| Houma | 3.9 /100 | #237 | Tragic 9.1% |
| Inupiat | 3.6 /100 | #238 | Tragic 9.1% |
| Mexicans | 3.5 /100 | #239 | Tragic 9.1% |
| Spanish | 3.3 /100 | #240 | Tragic 9.1% |
| Immigrants | Southern Europe | 2.8 /100 | #241 | Tragic 9.2% |
| Sierra Leoneans | 2.8 /100 | #242 | Tragic 9.2% |
| Slavs | 2.8 /100 | #243 | Tragic 9.2% |
Demographics Similar to Cherokee by Unemployment Among Seniors over 75 years
In terms of unemployment among seniors over 75 years, the demographic groups most similar to Cherokee are Immigrants from St. Vincent and the Grenadines (9.8%, a difference of 0.080%), Nonimmigrants (9.8%, a difference of 0.13%), Lithuanian (9.9%, a difference of 0.38%), Immigrants from Dominica (9.8%, a difference of 0.50%), and Norwegian (9.8%, a difference of 0.56%).
| Demographics | Rating | Rank | Unemployment Among Seniors over 75 years |
| Sioux | 0.0 /100 | #290 | Tragic 9.7% |
| Scandinavians | 0.0 /100 | #291 | Tragic 9.7% |
| Immigrants | Western Africa | 0.0 /100 | #292 | Tragic 9.8% |
| Norwegians | 0.0 /100 | #293 | Tragic 9.8% |
| Immigrants | Dominica | 0.0 /100 | #294 | Tragic 9.8% |
| Immigrants | Nonimmigrants | 0.0 /100 | #295 | Tragic 9.8% |
| Immigrants | St. Vincent and the Grenadines | 0.0 /100 | #296 | Tragic 9.8% |
| Cherokee | 0.0 /100 | #297 | Tragic 9.8% |
| Lithuanians | 0.0 /100 | #298 | Tragic 9.9% |
| Belgians | 0.0 /100 | #299 | Tragic 9.9% |
| Iraqis | 0.0 /100 | #300 | Tragic 9.9% |
| Welsh | 0.0 /100 | #301 | Tragic 10.0% |
| Finns | 0.0 /100 | #302 | Tragic 10.0% |
| Puget Sound Salish | 0.0 /100 | #303 | Tragic 10.0% |
| Scotch-Irish | 0.0 /100 | #304 | Tragic 10.0% |