Laotian vs Immigrants from Morocco Unemployment Among Ages 35 to 44 years
COMPARE
Laotian
Immigrants from Morocco
Unemployment Among Ages 35 to 44 years
Unemployment Among Ages 35 to 44 years Comparison
Laotians
Immigrants from Morocco
4.6%
UNEMPLOYMENT AMONG AGES 35 TO 44 YEARS
80.1/ 100
METRIC RATING
134th/ 347
METRIC RANK
4.7%
UNEMPLOYMENT AMONG AGES 35 TO 44 YEARS
57.2/ 100
METRIC RATING
164th/ 347
METRIC RANK
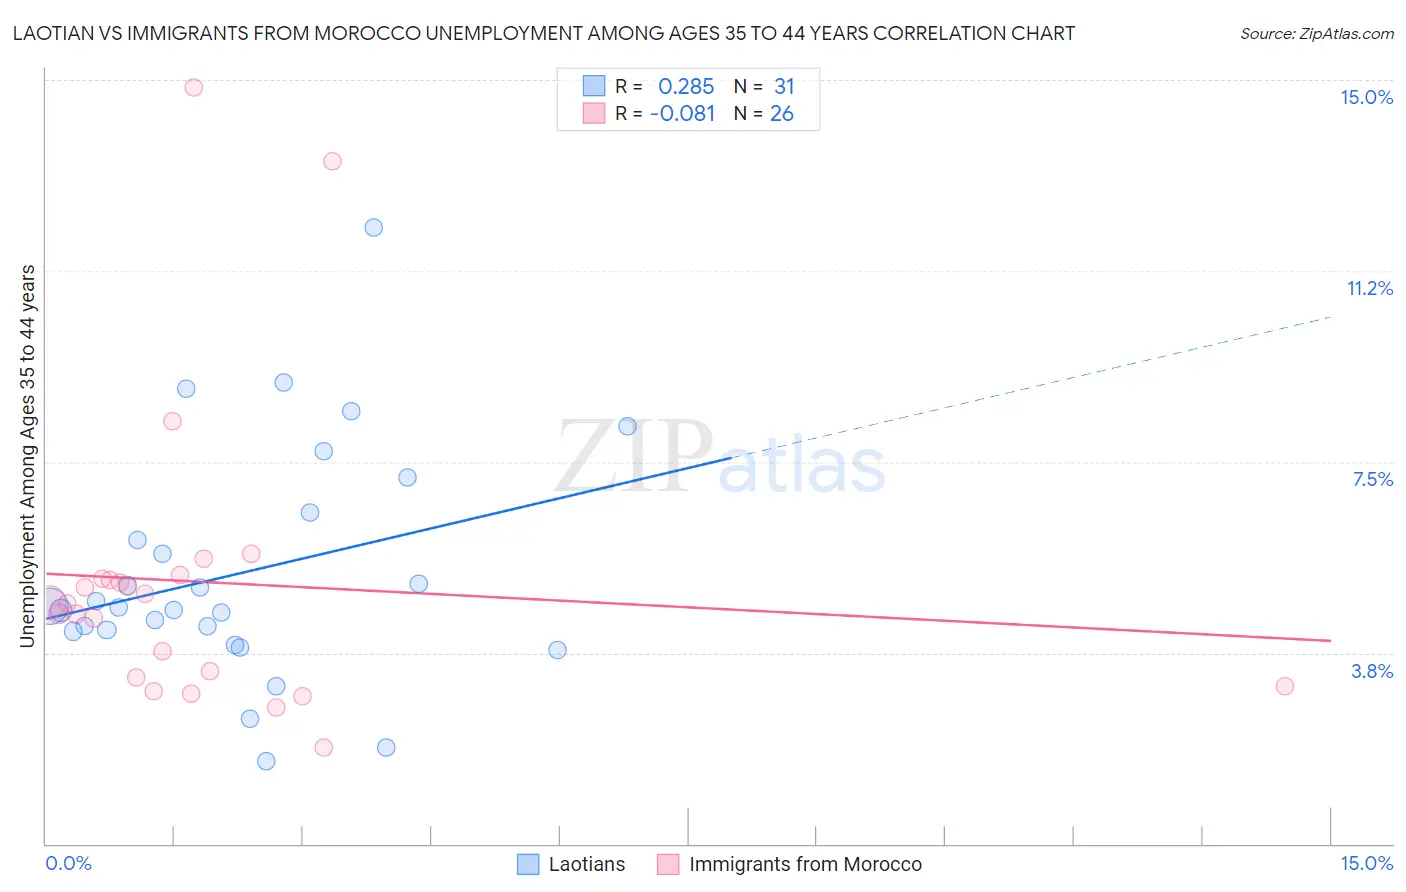
Laotian vs Immigrants from Morocco Unemployment Among Ages 35 to 44 years Correlation Chart
The statistical analysis conducted on geographies consisting of 222,731,722 people shows a weak positive correlation between the proportion of Laotians and unemployment rate among population between the ages 35 and 44 in the United States with a correlation coefficient (R) of 0.285 and weighted average of 4.6%. Similarly, the statistical analysis conducted on geographies consisting of 177,996,859 people shows a slight negative correlation between the proportion of Immigrants from Morocco and unemployment rate among population between the ages 35 and 44 in the United States with a correlation coefficient (R) of -0.081 and weighted average of 4.7%, a difference of 2.0%.
Unemployment Among Ages 35 to 44 years Correlation Summary
| Measurement | Laotian | Immigrants from Morocco |
| Minimum | 1.6% | 1.9% |
| Maximum | 12.1% | 14.9% |
| Range | 10.5% | 13.0% |
| Mean | 5.3% | 5.1% |
| Median | 4.6% | 4.7% |
| Interquartile 25% (IQ1) | 4.2% | 3.3% |
| Interquartile 75% (IQ3) | 6.5% | 5.2% |
| Interquartile Range (IQR) | 2.3% | 1.9% |
| Standard Deviation (Sample) | 2.3% | 3.0% |
| Standard Deviation (Population) | 2.2% | 2.9% |
Similar Demographics by Unemployment Among Ages 35 to 44 years
Demographics Similar to Laotians by Unemployment Among Ages 35 to 44 years
In terms of unemployment among ages 35 to 44 years, the demographic groups most similar to Laotians are Syrian (4.6%, a difference of 0.070%), Colombian (4.6%, a difference of 0.080%), Immigrants from Europe (4.6%, a difference of 0.080%), Scotch-Irish (4.6%, a difference of 0.090%), and Immigrants from Iraq (4.6%, a difference of 0.13%).
| Demographics | Rating | Rank | Unemployment Among Ages 35 to 44 years |
| Immigrants | Ethiopia | 84.7 /100 | #127 | Excellent 4.5% |
| Czechoslovakians | 83.4 /100 | #128 | Excellent 4.6% |
| Immigrants | Croatia | 83.1 /100 | #129 | Excellent 4.6% |
| Immigrants | Eritrea | 82.8 /100 | #130 | Excellent 4.6% |
| Immigrants | Colombia | 82.6 /100 | #131 | Excellent 4.6% |
| Colombians | 80.8 /100 | #132 | Excellent 4.6% |
| Syrians | 80.7 /100 | #133 | Excellent 4.6% |
| Laotians | 80.1 /100 | #134 | Excellent 4.6% |
| Immigrants | Europe | 79.4 /100 | #135 | Good 4.6% |
| Scotch-Irish | 79.3 /100 | #136 | Good 4.6% |
| Immigrants | Iraq | 78.9 /100 | #137 | Good 4.6% |
| Immigrants | Norway | 77.5 /100 | #138 | Good 4.6% |
| Immigrants | Hungary | 76.3 /100 | #139 | Good 4.6% |
| Immigrants | Eastern Africa | 76.0 /100 | #140 | Good 4.6% |
| Canadians | 75.9 /100 | #141 | Good 4.6% |
Demographics Similar to Immigrants from Morocco by Unemployment Among Ages 35 to 44 years
In terms of unemployment among ages 35 to 44 years, the demographic groups most similar to Immigrants from Morocco are German Russian (4.7%, a difference of 0.0%), South African (4.7%, a difference of 0.090%), French (4.7%, a difference of 0.12%), Costa Rican (4.7%, a difference of 0.18%), and Peruvian (4.7%, a difference of 0.20%).
| Demographics | Rating | Rank | Unemployment Among Ages 35 to 44 years |
| Immigrants | Belarus | 63.4 /100 | #157 | Good 4.6% |
| Immigrants | Iran | 63.1 /100 | #158 | Good 4.6% |
| Albanians | 63.0 /100 | #159 | Good 4.6% |
| Hungarians | 62.6 /100 | #160 | Good 4.6% |
| Celtics | 61.7 /100 | #161 | Good 4.7% |
| Costa Ricans | 59.6 /100 | #162 | Average 4.7% |
| South Africans | 58.5 /100 | #163 | Average 4.7% |
| Immigrants | Morocco | 57.2 /100 | #164 | Average 4.7% |
| German Russians | 57.2 /100 | #165 | Average 4.7% |
| French | 55.6 /100 | #166 | Average 4.7% |
| Peruvians | 54.4 /100 | #167 | Average 4.7% |
| Arabs | 53.1 /100 | #168 | Average 4.7% |
| Pennsylvania Germans | 53.0 /100 | #169 | Average 4.7% |
| Immigrants | Indonesia | 52.6 /100 | #170 | Average 4.7% |
| Indonesians | 51.7 /100 | #171 | Average 4.7% |