Pennsylvania German vs Australian Unemployment Among Ages 65 to 74 years
COMPARE
Pennsylvania German
Australian
Unemployment Among Ages 65 to 74 years
Unemployment Among Ages 65 to 74 years Comparison
Pennsylvania Germans
Australians
5.8%
UNEMPLOYMENT AMONG AGES 65 TO 74 YEARS
0.0/ 100
METRIC RATING
296th/ 347
METRIC RANK
5.3%
UNEMPLOYMENT AMONG AGES 65 TO 74 YEARS
90.4/ 100
METRIC RATING
116th/ 347
METRIC RANK
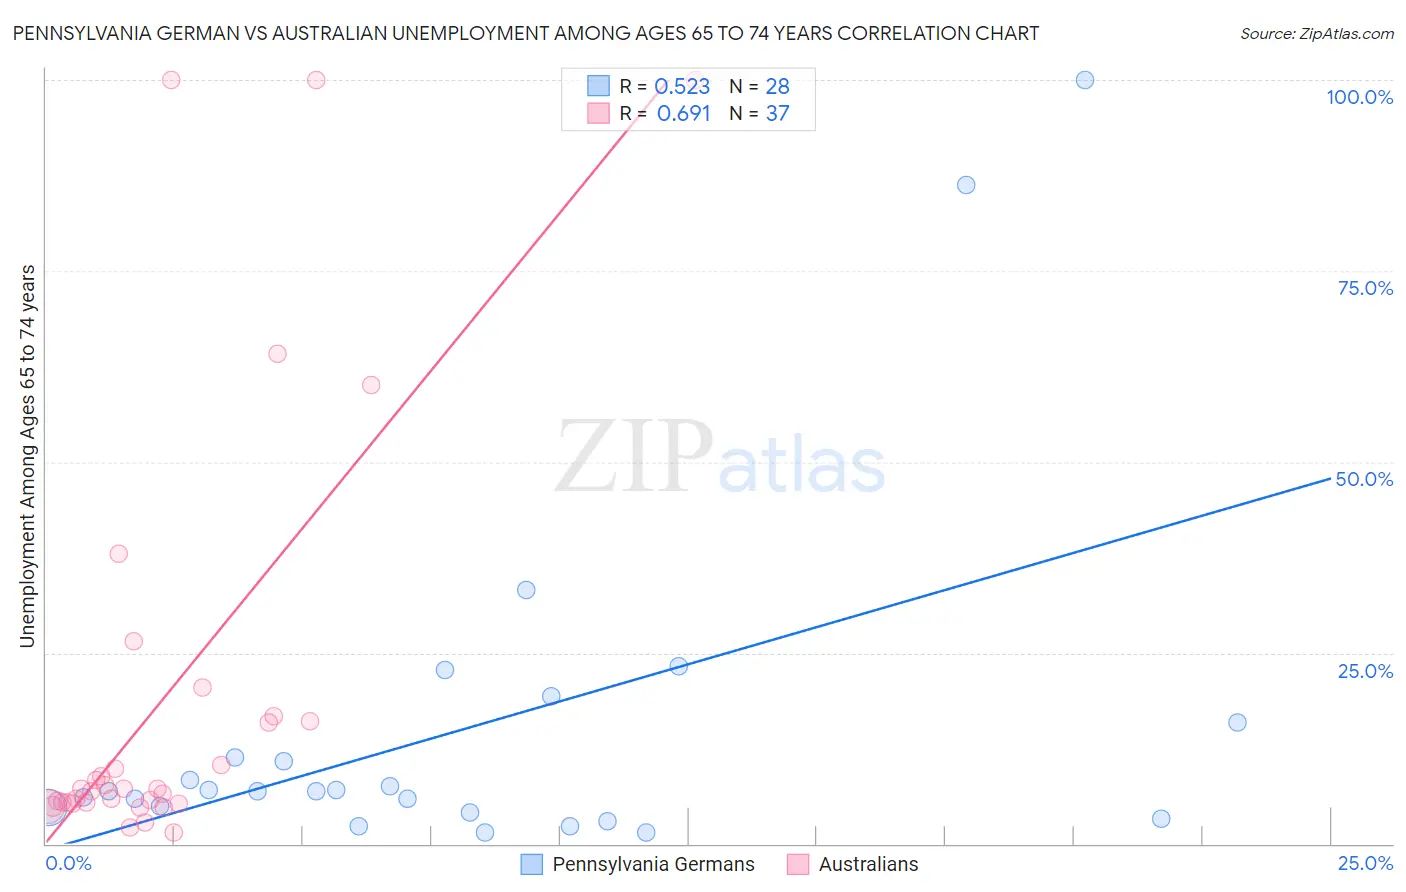
Pennsylvania German vs Australian Unemployment Among Ages 65 to 74 years Correlation Chart
The statistical analysis conducted on geographies consisting of 205,280,371 people shows a substantial positive correlation between the proportion of Pennsylvania Germans and unemployment rate among population between the ages 65 and 74 in the United States with a correlation coefficient (R) of 0.523 and weighted average of 5.8%. Similarly, the statistical analysis conducted on geographies consisting of 205,486,622 people shows a significant positive correlation between the proportion of Australians and unemployment rate among population between the ages 65 and 74 in the United States with a correlation coefficient (R) of 0.691 and weighted average of 5.3%, a difference of 10.1%.
Unemployment Among Ages 65 to 74 years Correlation Summary
| Measurement | Pennsylvania German | Australian |
| Minimum | 1.4% | 1.4% |
| Maximum | 100.0% | 100.0% |
| Range | 98.6% | 98.6% |
| Mean | 15.0% | 19.3% |
| Median | 6.9% | 7.2% |
| Interquartile 25% (IQ1) | 4.4% | 5.3% |
| Interquartile 75% (IQ3) | 13.6% | 16.4% |
| Interquartile Range (IQR) | 9.2% | 11.0% |
| Standard Deviation (Sample) | 23.4% | 28.1% |
| Standard Deviation (Population) | 23.0% | 27.7% |
Similar Demographics by Unemployment Among Ages 65 to 74 years
Demographics Similar to Pennsylvania Germans by Unemployment Among Ages 65 to 74 years
In terms of unemployment among ages 65 to 74 years, the demographic groups most similar to Pennsylvania Germans are Houma (5.8%, a difference of 0.17%), Immigrants from Latin America (5.8%, a difference of 0.36%), Barbadian (5.8%, a difference of 0.37%), Ecuadorian (5.8%, a difference of 0.38%), and Black/African American (5.8%, a difference of 0.46%).
| Demographics | Rating | Rank | Unemployment Among Ages 65 to 74 years |
| Immigrants | Somalia | 0.0 /100 | #289 | Tragic 5.7% |
| Spanish American Indians | 0.0 /100 | #290 | Tragic 5.7% |
| Portuguese | 0.0 /100 | #291 | Tragic 5.7% |
| U.S. Virgin Islanders | 0.0 /100 | #292 | Tragic 5.8% |
| Immigrants | Grenada | 0.0 /100 | #293 | Tragic 5.8% |
| Immigrants | Morocco | 0.0 /100 | #294 | Tragic 5.8% |
| Blacks/African Americans | 0.0 /100 | #295 | Tragic 5.8% |
| Pennsylvania Germans | 0.0 /100 | #296 | Tragic 5.8% |
| Houma | 0.0 /100 | #297 | Tragic 5.8% |
| Immigrants | Latin America | 0.0 /100 | #298 | Tragic 5.8% |
| Barbadians | 0.0 /100 | #299 | Tragic 5.8% |
| Ecuadorians | 0.0 /100 | #300 | Tragic 5.8% |
| Armenians | 0.0 /100 | #301 | Tragic 5.8% |
| Liberians | 0.0 /100 | #302 | Tragic 5.8% |
| Arapaho | 0.0 /100 | #303 | Tragic 5.8% |
Demographics Similar to Australians by Unemployment Among Ages 65 to 74 years
In terms of unemployment among ages 65 to 74 years, the demographic groups most similar to Australians are Immigrants from Korea (5.3%, a difference of 0.020%), Immigrants from Belarus (5.3%, a difference of 0.030%), Immigrants from Turkey (5.3%, a difference of 0.040%), Immigrants from Fiji (5.3%, a difference of 0.050%), and Immigrants from Switzerland (5.3%, a difference of 0.050%).
| Demographics | Rating | Rank | Unemployment Among Ages 65 to 74 years |
| Immigrants | Singapore | 93.9 /100 | #109 | Exceptional 5.2% |
| Immigrants | Bolivia | 93.6 /100 | #110 | Exceptional 5.2% |
| Sri Lankans | 92.7 /100 | #111 | Exceptional 5.3% |
| Immigrants | South Central Asia | 92.4 /100 | #112 | Exceptional 5.3% |
| Immigrants | Germany | 91.6 /100 | #113 | Exceptional 5.3% |
| Asians | 91.1 /100 | #114 | Exceptional 5.3% |
| Immigrants | Turkey | 90.8 /100 | #115 | Exceptional 5.3% |
| Australians | 90.4 /100 | #116 | Exceptional 5.3% |
| Immigrants | Korea | 90.2 /100 | #117 | Exceptional 5.3% |
| Immigrants | Belarus | 90.1 /100 | #118 | Exceptional 5.3% |
| Immigrants | Fiji | 89.9 /100 | #119 | Excellent 5.3% |
| Immigrants | Switzerland | 89.9 /100 | #120 | Excellent 5.3% |
| Immigrants | Australia | 89.1 /100 | #121 | Excellent 5.3% |
| Immigrants | Canada | 89.0 /100 | #122 | Excellent 5.3% |
| Czechoslovakians | 88.6 /100 | #123 | Excellent 5.3% |