Pennsylvania German vs Immigrants from Colombia Unemployment Among Ages 25 to 29 years
COMPARE
Pennsylvania German
Immigrants from Colombia
Unemployment Among Ages 25 to 29 years
Unemployment Among Ages 25 to 29 years Comparison
Pennsylvania Germans
Immigrants from Colombia
7.4%
UNEMPLOYMENT AMONG AGES 25 TO 29 YEARS
0.1/ 100
METRIC RATING
267th/ 347
METRIC RANK
6.4%
UNEMPLOYMENT AMONG AGES 25 TO 29 YEARS
87.6/ 100
METRIC RATING
111th/ 347
METRIC RANK
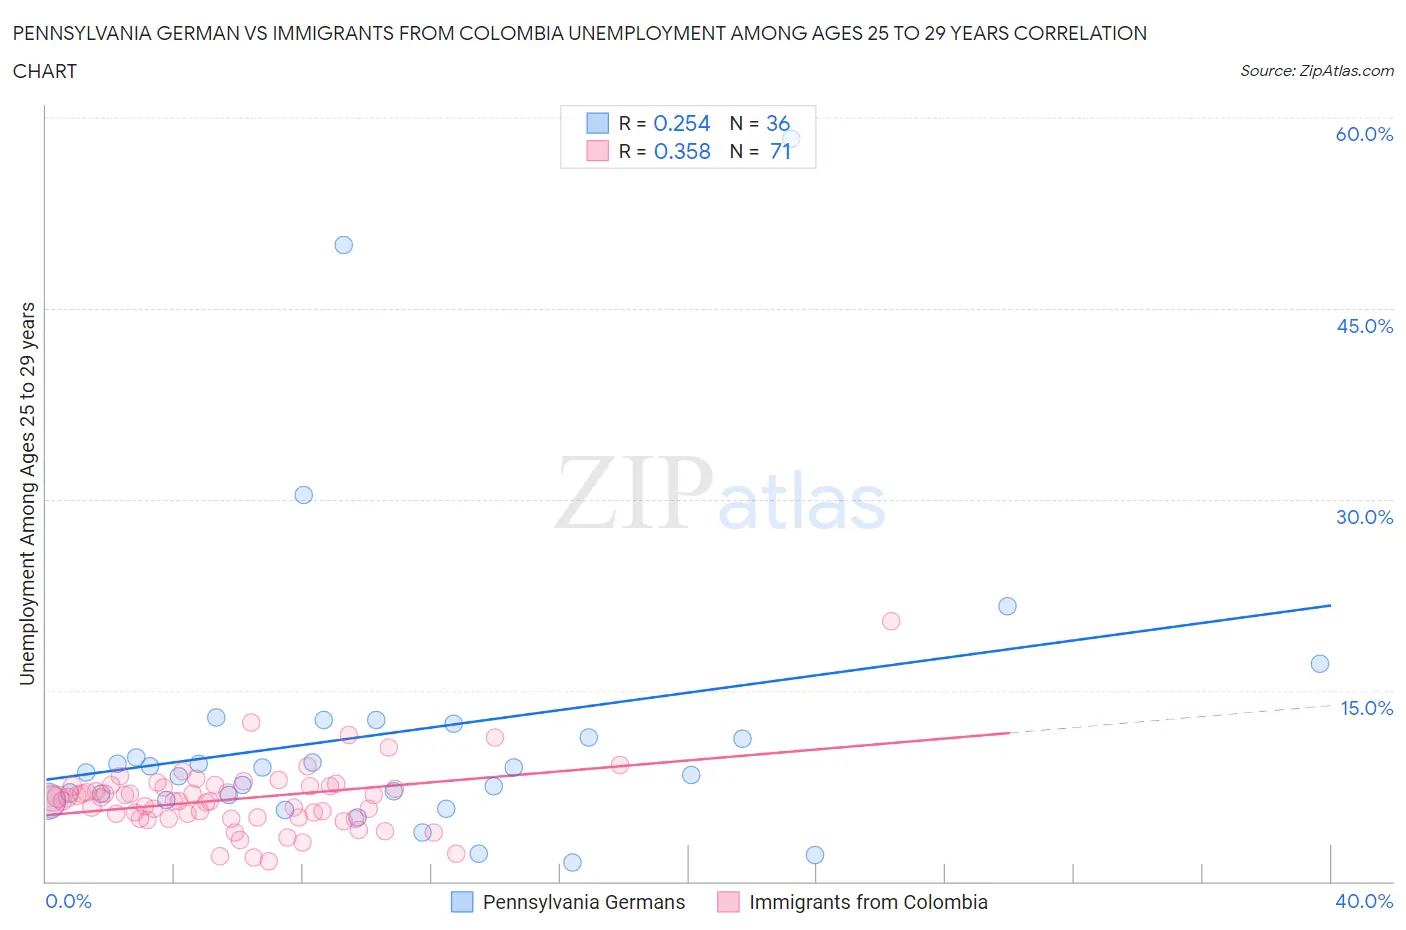
Pennsylvania German vs Immigrants from Colombia Unemployment Among Ages 25 to 29 years Correlation Chart
The statistical analysis conducted on geographies consisting of 221,850,589 people shows a weak positive correlation between the proportion of Pennsylvania Germans and unemployment rate among population between the ages 25 and 29 in the United States with a correlation coefficient (R) of 0.254 and weighted average of 7.4%. Similarly, the statistical analysis conducted on geographies consisting of 362,771,593 people shows a mild positive correlation between the proportion of Immigrants from Colombia and unemployment rate among population between the ages 25 and 29 in the United States with a correlation coefficient (R) of 0.358 and weighted average of 6.4%, a difference of 15.0%.
Unemployment Among Ages 25 to 29 years Correlation Summary
| Measurement | Pennsylvania German | Immigrants from Colombia |
| Minimum | 1.5% | 1.6% |
| Maximum | 58.3% | 20.4% |
| Range | 56.8% | 18.8% |
| Mean | 11.7% | 6.5% |
| Median | 8.7% | 6.3% |
| Interquartile 25% (IQ1) | 6.6% | 5.0% |
| Interquartile 75% (IQ3) | 11.9% | 7.4% |
| Interquartile Range (IQR) | 5.3% | 2.4% |
| Standard Deviation (Sample) | 11.8% | 2.7% |
| Standard Deviation (Population) | 11.6% | 2.7% |
Similar Demographics by Unemployment Among Ages 25 to 29 years
Demographics Similar to Pennsylvania Germans by Unemployment Among Ages 25 to 29 years
In terms of unemployment among ages 25 to 29 years, the demographic groups most similar to Pennsylvania Germans are Immigrants from Ecuador (7.4%, a difference of 0.020%), Paiute (7.4%, a difference of 0.070%), Immigrants from Latin America (7.4%, a difference of 0.080%), Immigrants from Fiji (7.4%, a difference of 0.21%), and Immigrants from Western Africa (7.4%, a difference of 0.27%).
| Demographics | Rating | Rank | Unemployment Among Ages 25 to 29 years |
| Americans | 0.1 /100 | #260 | Tragic 7.4% |
| Nigerians | 0.1 /100 | #261 | Tragic 7.4% |
| Ecuadorians | 0.1 /100 | #262 | Tragic 7.4% |
| Kiowa | 0.1 /100 | #263 | Tragic 7.4% |
| Immigrants | Western Africa | 0.1 /100 | #264 | Tragic 7.4% |
| Immigrants | Fiji | 0.1 /100 | #265 | Tragic 7.4% |
| Paiute | 0.1 /100 | #266 | Tragic 7.4% |
| Pennsylvania Germans | 0.1 /100 | #267 | Tragic 7.4% |
| Immigrants | Ecuador | 0.1 /100 | #268 | Tragic 7.4% |
| Immigrants | Latin America | 0.1 /100 | #269 | Tragic 7.4% |
| Bahamians | 0.0 /100 | #270 | Tragic 7.5% |
| Choctaw | 0.0 /100 | #271 | Tragic 7.5% |
| Immigrants | Bahamas | 0.0 /100 | #272 | Tragic 7.5% |
| Immigrants | Nigeria | 0.0 /100 | #273 | Tragic 7.5% |
| Immigrants | Central America | 0.0 /100 | #274 | Tragic 7.5% |
Demographics Similar to Immigrants from Colombia by Unemployment Among Ages 25 to 29 years
In terms of unemployment among ages 25 to 29 years, the demographic groups most similar to Immigrants from Colombia are Immigrants from Nicaragua (6.4%, a difference of 0.020%), European (6.4%, a difference of 0.040%), Immigrants from Albania (6.4%, a difference of 0.050%), Immigrants from Egypt (6.5%, a difference of 0.070%), and Croatian (6.4%, a difference of 0.090%).
| Demographics | Rating | Rank | Unemployment Among Ages 25 to 29 years |
| Cypriots | 90.1 /100 | #104 | Exceptional 6.4% |
| Immigrants | Kazakhstan | 89.8 /100 | #105 | Excellent 6.4% |
| Immigrants | Hungary | 89.4 /100 | #106 | Excellent 6.4% |
| Swiss | 88.6 /100 | #107 | Excellent 6.4% |
| Croatians | 88.2 /100 | #108 | Excellent 6.4% |
| Immigrants | Albania | 87.9 /100 | #109 | Excellent 6.4% |
| Europeans | 87.8 /100 | #110 | Excellent 6.4% |
| Immigrants | Colombia | 87.6 /100 | #111 | Excellent 6.4% |
| Immigrants | Nicaragua | 87.5 /100 | #112 | Excellent 6.4% |
| Immigrants | Egypt | 87.1 /100 | #113 | Excellent 6.5% |
| Germans | 86.3 /100 | #114 | Excellent 6.5% |
| Macedonians | 86.1 /100 | #115 | Excellent 6.5% |
| Pakistanis | 85.9 /100 | #116 | Excellent 6.5% |
| Immigrants | Uruguay | 85.7 /100 | #117 | Excellent 6.5% |
| Chileans | 85.3 /100 | #118 | Excellent 6.5% |