Immigrants from Ethiopia vs Immigrants from Middle Africa Unemployment Among Ages 30 to 34 years
COMPARE
Immigrants from Ethiopia
Immigrants from Middle Africa
Unemployment Among Ages 30 to 34 years
Unemployment Among Ages 30 to 34 years Comparison
Immigrants from Ethiopia
Immigrants from Middle Africa
5.0%
UNEMPLOYMENT AMONG AGES 30 TO 34 YEARS
99.2/ 100
METRIC RATING
35th/ 347
METRIC RANK
5.3%
UNEMPLOYMENT AMONG AGES 30 TO 34 YEARS
87.1/ 100
METRIC RATING
108th/ 347
METRIC RANK
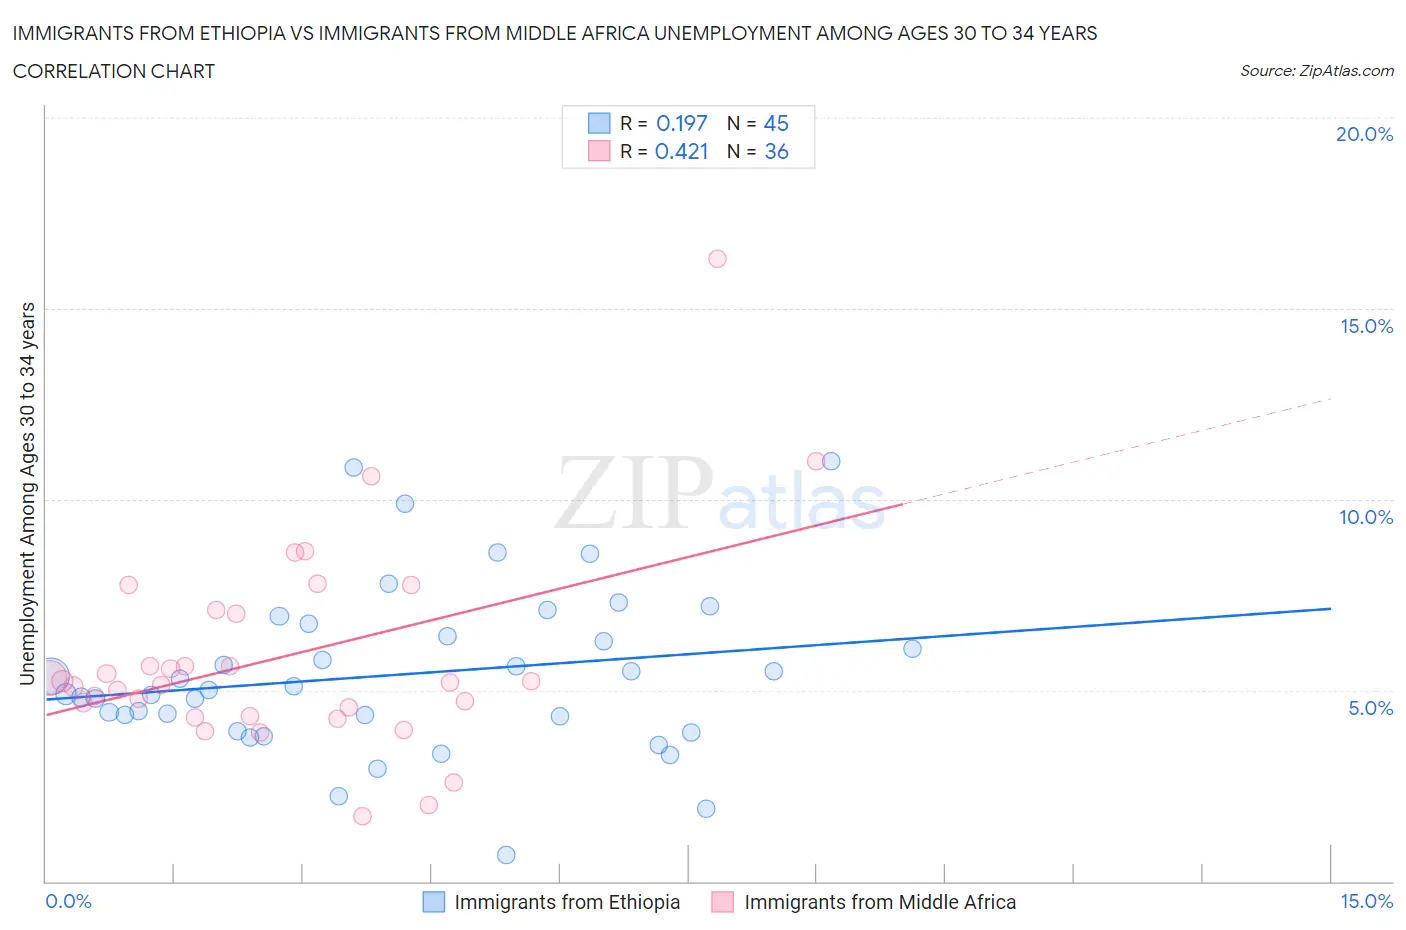
Immigrants from Ethiopia vs Immigrants from Middle Africa Unemployment Among Ages 30 to 34 years Correlation Chart
The statistical analysis conducted on geographies consisting of 206,073,213 people shows a poor positive correlation between the proportion of Immigrants from Ethiopia and unemployment rate among population between the ages 30 and 34 in the United States with a correlation coefficient (R) of 0.197 and weighted average of 5.0%. Similarly, the statistical analysis conducted on geographies consisting of 198,095,532 people shows a moderate positive correlation between the proportion of Immigrants from Middle Africa and unemployment rate among population between the ages 30 and 34 in the United States with a correlation coefficient (R) of 0.421 and weighted average of 5.3%, a difference of 5.4%.
Unemployment Among Ages 30 to 34 years Correlation Summary
| Measurement | Immigrants from Ethiopia | Immigrants from Middle Africa |
| Minimum | 0.70% | 1.7% |
| Maximum | 11.0% | 16.3% |
| Range | 10.3% | 14.6% |
| Mean | 5.4% | 5.9% |
| Median | 5.0% | 5.2% |
| Interquartile 25% (IQ1) | 4.1% | 4.4% |
| Interquartile 75% (IQ3) | 6.6% | 7.0% |
| Interquartile Range (IQR) | 2.4% | 2.6% |
| Standard Deviation (Sample) | 2.2% | 2.7% |
| Standard Deviation (Population) | 2.1% | 2.7% |
Similar Demographics by Unemployment Among Ages 30 to 34 years
Demographics Similar to Immigrants from Ethiopia by Unemployment Among Ages 30 to 34 years
In terms of unemployment among ages 30 to 34 years, the demographic groups most similar to Immigrants from Ethiopia are Czech (5.0%, a difference of 0.040%), Latvian (5.0%, a difference of 0.23%), Immigrants from Saudi Arabia (5.0%, a difference of 0.28%), Immigrants from Turkey (5.0%, a difference of 0.30%), and Sri Lankan (5.0%, a difference of 0.30%).
| Demographics | Rating | Rank | Unemployment Among Ages 30 to 34 years |
| Immigrants | Cuba | 99.4 /100 | #28 | Exceptional 5.0% |
| German Russians | 99.4 /100 | #29 | Exceptional 5.0% |
| Norwegians | 99.4 /100 | #30 | Exceptional 5.0% |
| Somalis | 99.3 /100 | #31 | Exceptional 5.0% |
| Immigrants | Zaire | 99.3 /100 | #32 | Exceptional 5.0% |
| Immigrants | Saudi Arabia | 99.3 /100 | #33 | Exceptional 5.0% |
| Latvians | 99.3 /100 | #34 | Exceptional 5.0% |
| Immigrants | Ethiopia | 99.2 /100 | #35 | Exceptional 5.0% |
| Czechs | 99.2 /100 | #36 | Exceptional 5.0% |
| Immigrants | Turkey | 99.0 /100 | #37 | Exceptional 5.0% |
| Sri Lankans | 99.0 /100 | #38 | Exceptional 5.0% |
| Fijians | 99.0 /100 | #39 | Exceptional 5.0% |
| Immigrants | Vietnam | 98.9 /100 | #40 | Exceptional 5.0% |
| Immigrants | Eastern Africa | 98.9 /100 | #41 | Exceptional 5.0% |
| Immigrants | Hong Kong | 98.8 /100 | #42 | Exceptional 5.0% |
Demographics Similar to Immigrants from Middle Africa by Unemployment Among Ages 30 to 34 years
In terms of unemployment among ages 30 to 34 years, the demographic groups most similar to Immigrants from Middle Africa are Icelander (5.3%, a difference of 0.010%), Immigrants from Chile (5.3%, a difference of 0.060%), Croatian (5.3%, a difference of 0.080%), Northern European (5.3%, a difference of 0.12%), and Argentinean (5.3%, a difference of 0.12%).
| Demographics | Rating | Rank | Unemployment Among Ages 30 to 34 years |
| British | 89.1 /100 | #101 | Excellent 5.3% |
| Immigrants | Switzerland | 88.8 /100 | #102 | Excellent 5.3% |
| Immigrants | Jordan | 88.8 /100 | #103 | Excellent 5.3% |
| Northern Europeans | 87.9 /100 | #104 | Excellent 5.3% |
| Argentineans | 87.9 /100 | #105 | Excellent 5.3% |
| Croatians | 87.6 /100 | #106 | Excellent 5.3% |
| Icelanders | 87.2 /100 | #107 | Excellent 5.3% |
| Immigrants | Middle Africa | 87.1 /100 | #108 | Excellent 5.3% |
| Immigrants | Chile | 86.7 /100 | #109 | Excellent 5.3% |
| Egyptians | 86.4 /100 | #110 | Excellent 5.3% |
| Immigrants | Pakistan | 86.2 /100 | #111 | Excellent 5.3% |
| Swiss | 85.9 /100 | #112 | Excellent 5.3% |
| Immigrants | Spain | 85.6 /100 | #113 | Excellent 5.3% |
| Estonians | 83.7 /100 | #114 | Excellent 5.3% |
| Immigrants | Albania | 83.4 /100 | #115 | Excellent 5.3% |