Pennsylvania German vs Alaska Native Unemployment Among Youth under 25 years

COMPARE

Pennsylvania German
Race
Ancestry
AfghanAfricanAlaskan AthabascanAlbanianAleutAlsatianAmericanApacheArabArapahoArgentineanArmenianAssyrian/Chaldean/SyriacAustralianAustrianBahamianBangladeshiBarbadianBasqueBelgianBelizeanBermudanBhutaneseBlackfeetBolivianBrazilianBritishBritish West IndianBulgarianBurmeseCajunCambodianCanadianCape VerdeanCarpatho RusynCelticCentral AmericanCentral American IndianCherokeeCheyenneChickasawChileanChineseChippewaChoctawColombianColvilleComancheCosta RicanCreeCreekCroatianCrowCubanCypriotCzechCzechoslovakianDanishDelawareDominicanDutchDutch West IndianEastern EuropeanEcuadorianEgyptianEnglishEstonianEthiopianEuropeanFijianFilipinoFinnishFrenchFrench American IndianFrench CanadianGermanGerman RussianGhanaianGreekGuamanian/ChamorroGuatemalanGuyaneseHaitianHmongHonduranHopiHoumaHungarianIcelanderIndian (Asian)IndonesianInupiatIranianIraqiIrishIroquoisIsraeliItalianJamaicanJapaneseJordanianKenyanKiowaKoreanLaotianLatvianLebaneseLiberianLithuanianLumbeeLuxembourgerMacedonianMalaysianMalteseMarshalleseMenomineeMexicanMexican American IndianMongolianMoroccanNative HawaiianNavajoNepaleseNew ZealanderNicaraguanNigerianNorthern EuropeanNorwegianOkinawanOsageOttawaPaiutePakistaniPalestinianPanamanianParaguayanPennsylvania GermanPeruvianPimaPolishPortuguesePotawatomiPuebloPuerto RicanPuget Sound SalishRomanianRussianSalvadoranSamoanScandinavianScotch-IrishScottishSeminoleSenegaleseSerbianShoshoneSierra LeoneanSiouxSlavicSlovakSloveneSomaliSouth AfricanSouth AmericanSouth American IndianSoviet UnionSpaniardSpanishSpanish AmericanSpanish American IndianSri LankanSubsaharan AfricanSudaneseSwedishSwissSyrianTaiwaneseThaiTlingit-HaidaTohono O'OdhamTonganTrinidadian and TobagonianTsimshianTurkishU.S. Virgin IslanderUgandanUkrainianUruguayanUteVenezuelanVietnameseWelshWest IndianYakamaYaquiYugoslavianYumanYup'ikZimbabwean
Immigration
NonimmigrantsImmigrantsAfghanistanAfricaAlbaniaArgentinaArmeniaAsiaAustraliaAustriaBahamasBangladeshBarbadosBelarusBelgiumBelizeBoliviaBosnia and HerzegovinaBrazilBulgariaBurma/MyanmarCabo VerdeCambodiaCameroonCanadaCaribbeanCentral AmericaChileChinaColombiaCongoCosta RicaCroatiaCubaCzechoslovakiaDenmarkDominicaDominican RepublicEastern AfricaEastern AsiaEastern EuropeEcuadorEgyptEl SalvadorEnglandEritreaEthiopiaEuropeFijiFranceGermanyGhanaGreeceGrenadaGuatemalaGuyanaHaitiHondurasHong KongHungaryIndiaIndonesiaIranIraqIrelandIsraelItalyJamaicaJapanJordanKazakhstanKenyaKoreaKuwaitLaosLatin AmericaLatviaLebanonLiberiaLithuaniaMalaysiaMexicoMicronesiaMiddle AfricaMoldovaMoroccoNepalNetherlandsNicaraguaNigeriaNorth AmericaNorth MacedoniaNorthern AfricaNorthern EuropeNorwayOceaniaPakistanPanamaPeruPhilippinesPolandPortugalRomaniaRussiaSaudi ArabiaScotlandSenegalSerbiaSierra LeoneSingaporeSomaliaSouth AfricaSouth AmericaSouth Central AsiaSouth Eastern AsiaSouthern EuropeSpainSri LankaSt. Vincent and the GrenadinesSudanSwedenSwitzerlandSyriaTaiwanThailandTrinidad and TobagoTurkeyUgandaUkraineUruguayUzbekistanVenezuelaVietnamWest IndiesWestern AfricaWestern AsiaWestern EuropeYemenZaireZimbabweAzores
Alaska Native
Race
Ancestry
AfghanAfricanAlaska NativeAlaskan AthabascanAlbanianAleutAlsatianAmericanApacheArabArapahoArgentineanArmenianAssyrian/Chaldean/SyriacAustralianAustrianBahamianBangladeshiBarbadianBasqueBelgianBelizeanBermudanBhutaneseBlackfeetBolivianBrazilianBritishBritish West IndianBulgarianBurmeseCajunCambodianCanadianCape VerdeanCarpatho RusynCelticCentral AmericanCentral American IndianCherokeeCheyenneChickasawChileanChineseChippewaChoctawColombianColvilleComancheCosta RicanCreeCreekCroatianCrowCubanCypriotCzechCzechoslovakianDanishDelawareDominicanDutchDutch West IndianEastern EuropeanEcuadorianEgyptianEnglishEstonianEthiopianEuropeanFijianFilipinoFinnishFrenchFrench American IndianFrench CanadianGermanGerman RussianGhanaianGreekGuamanian/ChamorroGuatemalanGuyaneseHaitianHmongHonduranHopiHoumaHungarianIcelanderIndian (Asian)IndonesianInupiatIranianIraqiIrishIroquoisIsraeliItalianJamaicanJapaneseJordanianKenyanKiowaKoreanLaotianLatvianLebaneseLiberianLithuanianLumbeeLuxembourgerMacedonianMalaysianMalteseMarshalleseMenomineeMexicanMexican American IndianMongolianMoroccanNative HawaiianNavajoNepaleseNew ZealanderNicaraguanNigerianNorthern EuropeanNorwegianOkinawanOsageOttawaPaiutePakistaniPalestinianPanamanianParaguayanPeruvianPimaPolishPortuguesePotawatomiPuebloPuerto RicanPuget Sound SalishRomanianRussianSalvadoranSamoanScandinavianScotch-IrishScottishSeminoleSenegaleseSerbianShoshoneSierra LeoneanSiouxSlavicSlovakSloveneSomaliSouth AfricanSouth AmericanSouth American IndianSoviet UnionSpaniardSpanishSpanish AmericanSpanish American IndianSri LankanSubsaharan AfricanSudaneseSwedishSwissSyrianTaiwaneseThaiTlingit-HaidaTohono O'OdhamTonganTrinidadian and TobagonianTsimshianTurkishU.S. Virgin IslanderUgandanUkrainianUruguayanUteVenezuelanVietnameseWelshWest IndianYakamaYaquiYugoslavianYumanYup'ikZimbabwean
Immigration
NonimmigrantsImmigrantsAfghanistanAfricaAlbaniaArgentinaArmeniaAsiaAustraliaAustriaBahamasBangladeshBarbadosBelarusBelgiumBelizeBoliviaBosnia and HerzegovinaBrazilBulgariaBurma/MyanmarCabo VerdeCambodiaCameroonCanadaCaribbeanCentral AmericaChileChinaColombiaCongoCosta RicaCroatiaCubaCzechoslovakiaDenmarkDominicaDominican RepublicEastern AfricaEastern AsiaEastern EuropeEcuadorEgyptEl SalvadorEnglandEritreaEthiopiaEuropeFijiFranceGermanyGhanaGreeceGrenadaGuatemalaGuyanaHaitiHondurasHong KongHungaryIndiaIndonesiaIranIraqIrelandIsraelItalyJamaicaJapanJordanKazakhstanKenyaKoreaKuwaitLaosLatin AmericaLatviaLebanonLiberiaLithuaniaMalaysiaMexicoMicronesiaMiddle AfricaMoldovaMoroccoNepalNetherlandsNicaraguaNigeriaNorth AmericaNorth MacedoniaNorthern AfricaNorthern EuropeNorwayOceaniaPakistanPanamaPeruPhilippinesPolandPortugalRomaniaRussiaSaudi ArabiaScotlandSenegalSerbiaSierra LeoneSingaporeSomaliaSouth AfricaSouth AmericaSouth Central AsiaSouth Eastern AsiaSouthern EuropeSpainSri LankaSt. Vincent and the GrenadinesSudanSwedenSwitzerlandSyriaTaiwanThailandTrinidad and TobagoTurkeyUgandaUkraineUruguayUzbekistanVenezuelaVietnamWest IndiesWestern AfricaWestern AsiaWestern EuropeYemenZaireZimbabweAzores
Unemployment Among Youth under 25 years
Income
Poverty
Unemployment
Labor Participation
Family Structure
Vehicle Availability
Education Level
Disability

Unemployment Among Youth under 25 years Comparison

Pennsylvania Germans

Alaska Natives

Exceptional
Tragic
10.6%
UNEMPLOYMENT AMONG YOUTH UNDER 25 YEARS
100.0/ 100
METRIC RATING
21st/ 347
METRIC RANK
14.9%
UNEMPLOYMENT AMONG YOUTH UNDER 25 YEARS
0.0/ 100
METRIC RATING
325th/ 347
METRIC RANK

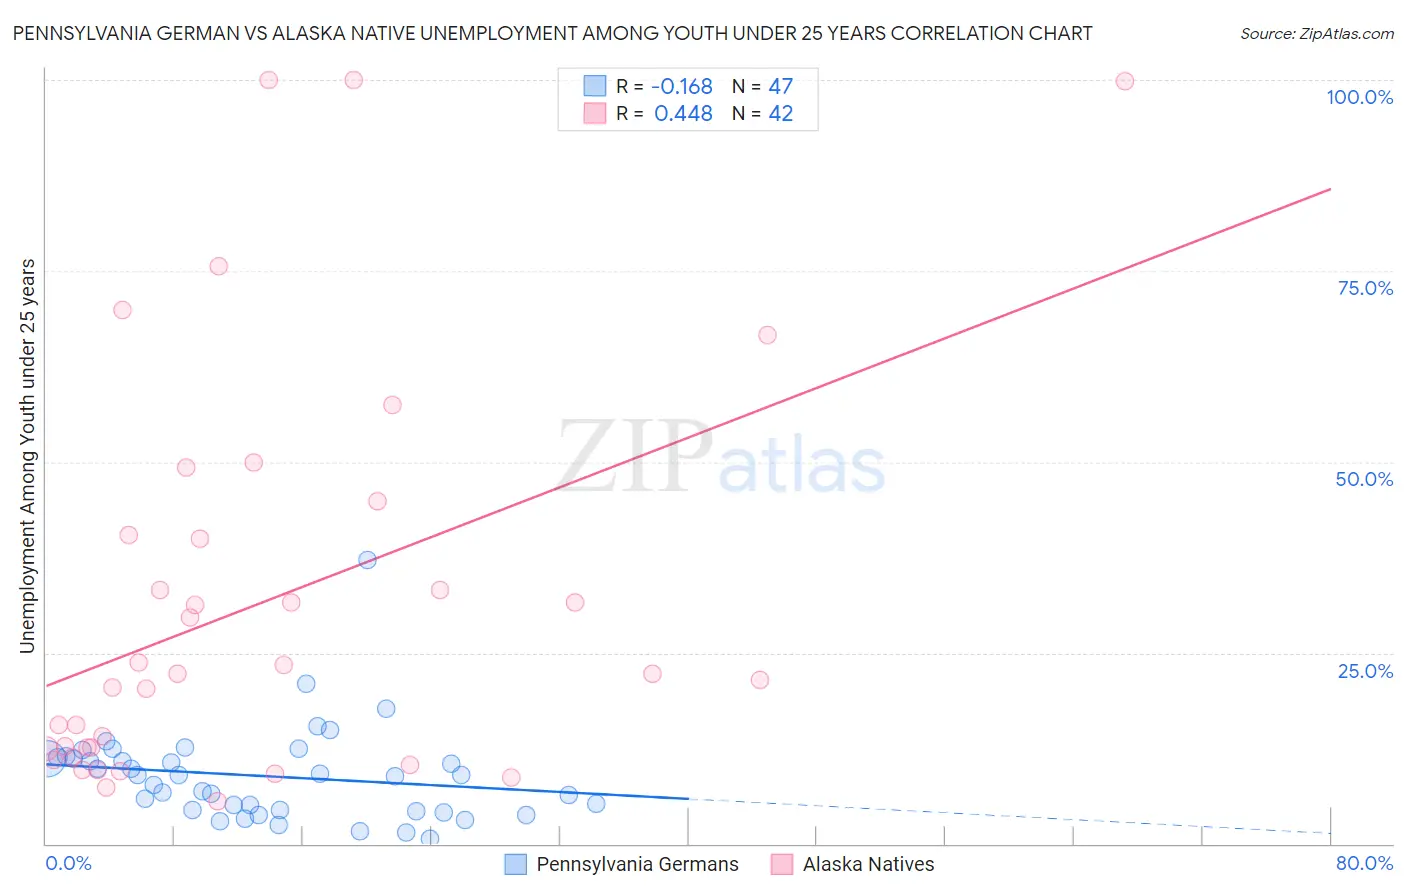
Pennsylvania German vs Alaska Native Unemployment Among Youth under 25 years Correlation Chart

The statistical analysis conducted on geographies consisting of 230,294,303 people shows a poor negative correlation between the proportion of Pennsylvania Germans and unemployment rate among youth under the age of 25 in the United States with a correlation coefficient (R) of -0.168 and weighted average of 10.6%. Similarly, the statistical analysis conducted on geographies consisting of 76,575,345 people shows a moderate positive correlation between the proportion of Alaska Natives and unemployment rate among youth under the age of 25 in the United States with a correlation coefficient (R) of 0.448 and weighted average of 14.9%, a difference of 40.3%.
Pennsylvania German vs Alaska Native Unemployment Among Youth under 25 years

Unemployment Among Youth under 25 years Correlation Summary

MeasurementPennsylvania GermanAlaska Native
Minimum0.60%5.6%
Maximum37.2%100.0%
Range36.6%94.4%
Mean8.9%31.6%
Median9.0%22.2%
Interquartile 25% (IQ1)4.4%12.5%
Interquartile 75% (IQ3)11.3%40.4%
Interquartile Range (IQR)6.9%28.0%
Standard Deviation (Sample)6.1%26.3%
Standard Deviation (Population)6.1%25.9%

Similar Demographics by Unemployment Among Youth under 25 years

Demographics Similar to Pennsylvania Germans by Unemployment Among Youth under 25 years

In terms of unemployment among youth under 25 years, the demographic groups most similar to Pennsylvania Germans are Belgian (10.6%, a difference of 0.010%), Immigrants from Bosnia and Herzegovina (10.6%, a difference of 0.070%), Dutch (10.6%, a difference of 0.21%), Immigrants from Burma/Myanmar (10.6%, a difference of 0.23%), and Swiss (10.6%, a difference of 0.25%).
DemographicsRating | RankUnemployment Among Youth under 25 years
Cubans
100.0
/100
|
#14
Exceptional
10.6%
Sudanese
100.0
/100
|
#15
Exceptional
10.6%
Venezuelans
100.0
/100
|
#16
Exceptional
10.6%
Menominee
100.0
/100
|
#17
Exceptional
10.6%
Swiss
100.0
/100
|
#18
Exceptional
10.6%
Immigrants | Burma/Myanmar
100.0
/100
|
#19
Exceptional
10.6%
Dutch
100.0
/100
|
#20
Exceptional
10.6%
Pennsylvania Germans
100.0
/100
|
#21
Exceptional
10.6%
Belgians
100.0
/100
|
#22
Exceptional
10.6%
Immigrants | Bosnia and Herzegovina
100.0
/100
|
#23
Exceptional
10.6%
Finns
100.0
/100
|
#24
Exceptional
10.7%
Immigrants | North Macedonia
100.0
/100
|
#25
Exceptional
10.7%
Immigrants | India
100.0
/100
|
#26
Exceptional
10.7%
Yugoslavians
100.0
/100
|
#27
Exceptional
10.7%
Somalis
100.0
/100
|
#28
Exceptional
10.7%

Demographics Similar to Alaska Natives by Unemployment Among Youth under 25 years

In terms of unemployment among youth under 25 years, the demographic groups most similar to Alaska Natives are Immigrants from Jamaica (14.8%, a difference of 0.67%), Immigrants from Trinidad and Tobago (14.6%, a difference of 1.8%), Trinidadian and Tobagonian (14.6%, a difference of 1.9%), Cheyenne (14.6%, a difference of 2.0%), and Barbadian (14.6%, a difference of 2.2%).
DemographicsRating | RankUnemployment Among Youth under 25 years
Immigrants | Dominica
0.0
/100
|
#318
Tragic
14.6%
West Indians
0.0
/100
|
#319
Tragic
14.6%
Barbadians
0.0
/100
|
#320
Tragic
14.6%
Cheyenne
0.0
/100
|
#321
Tragic
14.6%
Trinidadians and Tobagonians
0.0
/100
|
#322
Tragic
14.6%
Immigrants | Trinidad and Tobago
0.0
/100
|
#323
Tragic
14.6%
Immigrants | Jamaica
0.0
/100
|
#324
Tragic
14.8%
Alaska Natives
0.0
/100
|
#325
Tragic
14.9%
Immigrants | Barbados
0.0
/100
|
#326
Tragic
15.2%
British West Indians
0.0
/100
|
#327
Tragic
15.5%
Immigrants | Dominican Republic
0.0
/100
|
#328
Tragic
15.6%
Immigrants | Yemen
0.0
/100
|
#329
Tragic
15.6%
Yakama
0.0
/100
|
#330
Tragic
15.6%
Dominicans
0.0
/100
|
#331
Tragic
15.7%
Immigrants | Grenada
0.0
/100
|
#332
Tragic
15.8%