Pennsylvania German vs Belgian Unemployment Among Women with Children Under 6 years
COMPARE
Pennsylvania German
Belgian
Unemployment Among Women with Children Under 6 years
Unemployment Among Women with Children Under 6 years Comparison
Pennsylvania Germans
Belgians
10.8%
UNEMPLOYMENT AMONG WOMEN WITH CHILDREN UNDER 6 YEARS
0.0/ 100
METRIC RATING
330th/ 347
METRIC RANK
7.6%
UNEMPLOYMENT AMONG WOMEN WITH CHILDREN UNDER 6 YEARS
63.5/ 100
METRIC RATING
166th/ 347
METRIC RANK
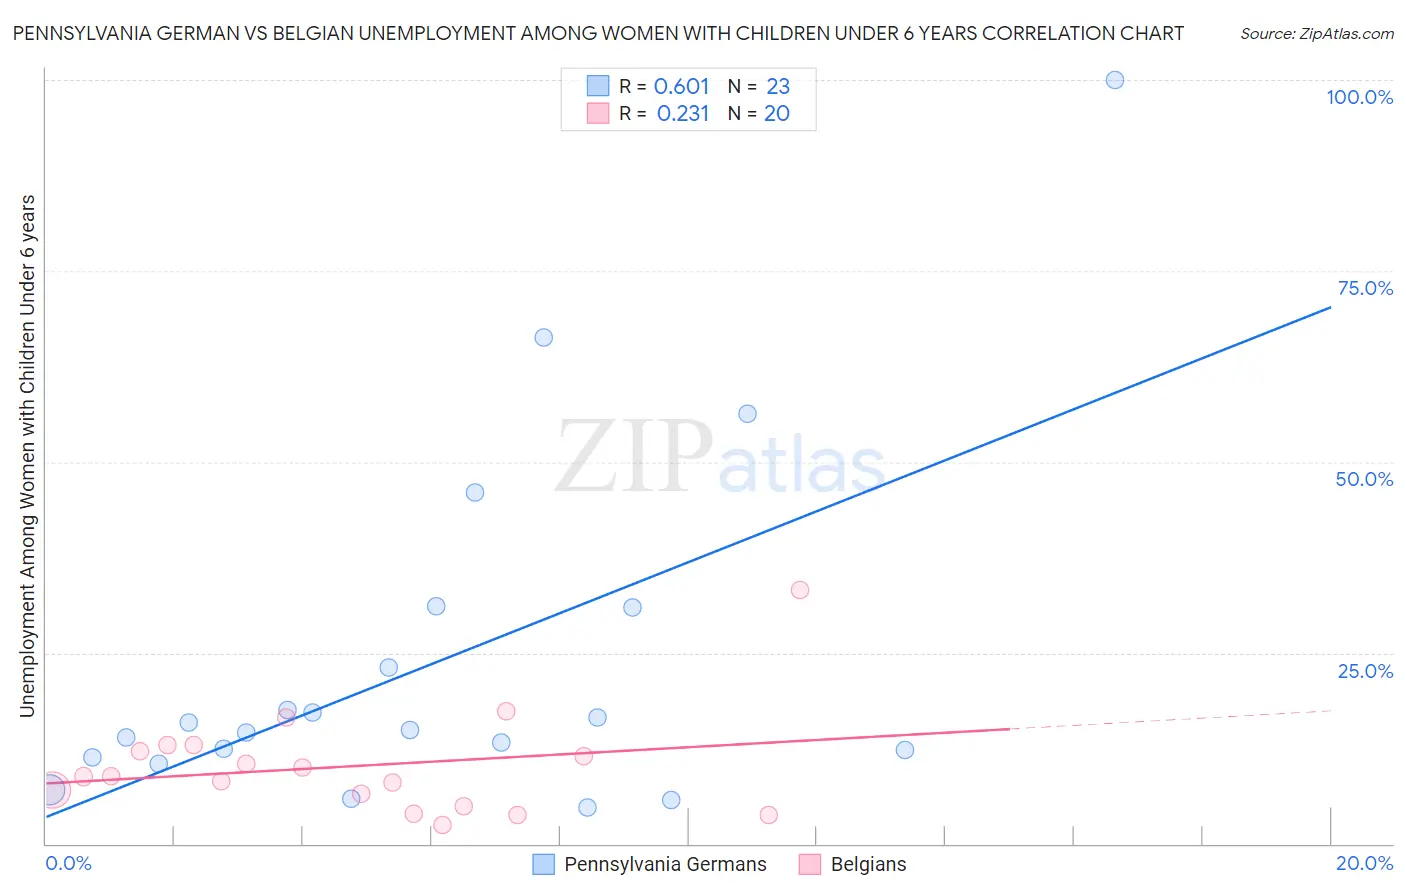
Pennsylvania German vs Belgian Unemployment Among Women with Children Under 6 years Correlation Chart
The statistical analysis conducted on geographies consisting of 181,724,497 people shows a significant positive correlation between the proportion of Pennsylvania Germans and unemployment rate among women with children under the age of 6 in the United States with a correlation coefficient (R) of 0.601 and weighted average of 10.8%. Similarly, the statistical analysis conducted on geographies consisting of 265,159,177 people shows a weak positive correlation between the proportion of Belgians and unemployment rate among women with children under the age of 6 in the United States with a correlation coefficient (R) of 0.231 and weighted average of 7.6%, a difference of 42.1%.
Unemployment Among Women with Children Under 6 years Correlation Summary
| Measurement | Pennsylvania German | Belgian |
| Minimum | 4.7% | 2.4% |
| Maximum | 100.0% | 33.3% |
| Range | 95.3% | 30.9% |
| Mean | 23.8% | 10.2% |
| Median | 14.9% | 8.8% |
| Interquartile 25% (IQ1) | 11.3% | 5.7% |
| Interquartile 75% (IQ3) | 31.0% | 12.5% |
| Interquartile Range (IQR) | 19.7% | 6.7% |
| Standard Deviation (Sample) | 23.1% | 6.8% |
| Standard Deviation (Population) | 22.6% | 6.7% |
Similar Demographics by Unemployment Among Women with Children Under 6 years
Demographics Similar to Pennsylvania Germans by Unemployment Among Women with Children Under 6 years
In terms of unemployment among women with children under 6 years, the demographic groups most similar to Pennsylvania Germans are Colville (11.2%, a difference of 3.6%), Black/African American (10.3%, a difference of 4.8%), Tohono O'odham (10.2%, a difference of 5.6%), Sioux (11.5%, a difference of 6.4%), and Native/Alaskan (11.5%, a difference of 7.0%).
| Demographics | Rating | Rank | Unemployment Among Women with Children Under 6 years |
| Immigrants | Bahamas | 0.0 /100 | #323 | Tragic 9.6% |
| Paiute | 0.0 /100 | #324 | Tragic 9.7% |
| Choctaw | 0.0 /100 | #325 | Tragic 9.8% |
| Delaware | 0.0 /100 | #326 | Tragic 9.8% |
| Ottawa | 0.0 /100 | #327 | Tragic 9.9% |
| Tohono O'odham | 0.0 /100 | #328 | Tragic 10.2% |
| Blacks/African Americans | 0.0 /100 | #329 | Tragic 10.3% |
| Pennsylvania Germans | 0.0 /100 | #330 | Tragic 10.8% |
| Colville | 0.0 /100 | #331 | Tragic 11.2% |
| Sioux | 0.0 /100 | #332 | Tragic 11.5% |
| Natives/Alaskans | 0.0 /100 | #333 | Tragic 11.5% |
| Apache | 0.0 /100 | #334 | Tragic 12.3% |
| Puerto Ricans | 0.0 /100 | #335 | Tragic 12.5% |
| Shoshone | 0.0 /100 | #336 | Tragic 13.2% |
| Chippewa | 0.0 /100 | #337 | Tragic 13.3% |
Demographics Similar to Belgians by Unemployment Among Women with Children Under 6 years
In terms of unemployment among women with children under 6 years, the demographic groups most similar to Belgians are Kenyan (7.6%, a difference of 0.070%), Immigrants from Canada (7.6%, a difference of 0.14%), Immigrants from South America (7.6%, a difference of 0.15%), Immigrants from Scotland (7.6%, a difference of 0.15%), and Ugandan (7.6%, a difference of 0.17%).
| Demographics | Rating | Rank | Unemployment Among Women with Children Under 6 years |
| Immigrants | Philippines | 71.3 /100 | #159 | Good 7.5% |
| Bolivians | 70.8 /100 | #160 | Good 7.5% |
| Immigrants | Western Asia | 70.2 /100 | #161 | Good 7.5% |
| Immigrants | Lithuania | 68.8 /100 | #162 | Good 7.5% |
| British | 66.3 /100 | #163 | Good 7.6% |
| Ugandans | 65.8 /100 | #164 | Good 7.6% |
| Immigrants | South America | 65.6 /100 | #165 | Good 7.6% |
| Belgians | 63.5 /100 | #166 | Good 7.6% |
| Kenyans | 62.5 /100 | #167 | Good 7.6% |
| Immigrants | Canada | 61.6 /100 | #168 | Good 7.6% |
| Immigrants | Scotland | 61.3 /100 | #169 | Good 7.6% |
| Czechs | 59.8 /100 | #170 | Average 7.6% |
| Immigrants | Grenada | 59.0 /100 | #171 | Average 7.6% |
| Immigrants | North America | 57.7 /100 | #172 | Average 7.6% |
| Cree | 51.6 /100 | #173 | Average 7.6% |