Pennsylvania German vs Immigrants from Poland Unemployment Among Women with Children Under 6 years
COMPARE
Pennsylvania German
Immigrants from Poland
Unemployment Among Women with Children Under 6 years
Unemployment Among Women with Children Under 6 years Comparison
Pennsylvania Germans
Immigrants from Poland
10.8%
UNEMPLOYMENT AMONG WOMEN WITH CHILDREN UNDER 6 YEARS
0.0/ 100
METRIC RATING
330th/ 347
METRIC RANK
7.8%
UNEMPLOYMENT AMONG WOMEN WITH CHILDREN UNDER 6 YEARS
27.3/ 100
METRIC RATING
199th/ 347
METRIC RANK
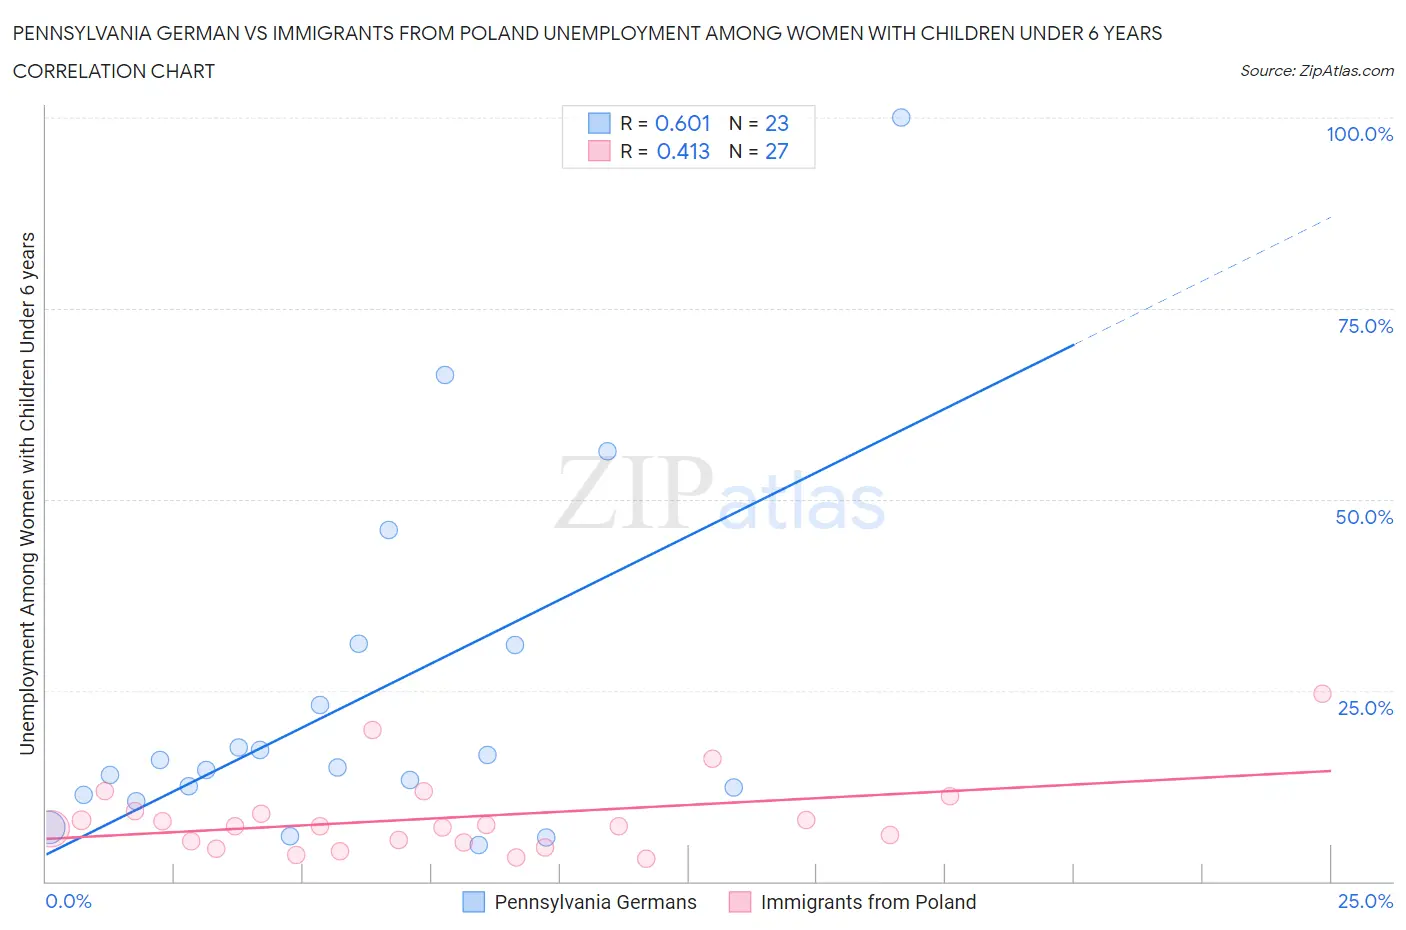
Pennsylvania German vs Immigrants from Poland Unemployment Among Women with Children Under 6 years Correlation Chart
The statistical analysis conducted on geographies consisting of 181,724,497 people shows a significant positive correlation between the proportion of Pennsylvania Germans and unemployment rate among women with children under the age of 6 in the United States with a correlation coefficient (R) of 0.601 and weighted average of 10.8%. Similarly, the statistical analysis conducted on geographies consisting of 238,421,278 people shows a moderate positive correlation between the proportion of Immigrants from Poland and unemployment rate among women with children under the age of 6 in the United States with a correlation coefficient (R) of 0.413 and weighted average of 7.8%, a difference of 38.6%.
Unemployment Among Women with Children Under 6 years Correlation Summary
| Measurement | Pennsylvania German | Immigrants from Poland |
| Minimum | 4.7% | 3.0% |
| Maximum | 100.0% | 24.6% |
| Range | 95.3% | 21.6% |
| Mean | 23.8% | 8.3% |
| Median | 14.9% | 7.2% |
| Interquartile 25% (IQ1) | 11.3% | 5.1% |
| Interquartile 75% (IQ3) | 31.0% | 9.1% |
| Interquartile Range (IQR) | 19.7% | 4.0% |
| Standard Deviation (Sample) | 23.1% | 5.0% |
| Standard Deviation (Population) | 22.6% | 4.9% |
Similar Demographics by Unemployment Among Women with Children Under 6 years
Demographics Similar to Pennsylvania Germans by Unemployment Among Women with Children Under 6 years
In terms of unemployment among women with children under 6 years, the demographic groups most similar to Pennsylvania Germans are Colville (11.2%, a difference of 3.6%), Black/African American (10.3%, a difference of 4.8%), Tohono O'odham (10.2%, a difference of 5.6%), Sioux (11.5%, a difference of 6.4%), and Native/Alaskan (11.5%, a difference of 7.0%).
| Demographics | Rating | Rank | Unemployment Among Women with Children Under 6 years |
| Immigrants | Bahamas | 0.0 /100 | #323 | Tragic 9.6% |
| Paiute | 0.0 /100 | #324 | Tragic 9.7% |
| Choctaw | 0.0 /100 | #325 | Tragic 9.8% |
| Delaware | 0.0 /100 | #326 | Tragic 9.8% |
| Ottawa | 0.0 /100 | #327 | Tragic 9.9% |
| Tohono O'odham | 0.0 /100 | #328 | Tragic 10.2% |
| Blacks/African Americans | 0.0 /100 | #329 | Tragic 10.3% |
| Pennsylvania Germans | 0.0 /100 | #330 | Tragic 10.8% |
| Colville | 0.0 /100 | #331 | Tragic 11.2% |
| Sioux | 0.0 /100 | #332 | Tragic 11.5% |
| Natives/Alaskans | 0.0 /100 | #333 | Tragic 11.5% |
| Apache | 0.0 /100 | #334 | Tragic 12.3% |
| Puerto Ricans | 0.0 /100 | #335 | Tragic 12.5% |
| Shoshone | 0.0 /100 | #336 | Tragic 13.2% |
| Chippewa | 0.0 /100 | #337 | Tragic 13.3% |
Demographics Similar to Immigrants from Poland by Unemployment Among Women with Children Under 6 years
In terms of unemployment among women with children under 6 years, the demographic groups most similar to Immigrants from Poland are Guamanian/Chamorro (7.8%, a difference of 0.15%), Lithuanian (7.8%, a difference of 0.21%), Basque (7.8%, a difference of 0.22%), Italian (7.7%, a difference of 0.25%), and Malaysian (7.7%, a difference of 0.30%).
| Demographics | Rating | Rank | Unemployment Among Women with Children Under 6 years |
| Immigrants | Africa | 32.4 /100 | #192 | Fair 7.7% |
| Slavs | 32.4 /100 | #193 | Fair 7.7% |
| Syrians | 31.9 /100 | #194 | Fair 7.7% |
| Malaysians | 31.1 /100 | #195 | Fair 7.7% |
| Immigrants | St. Vincent and the Grenadines | 31.1 /100 | #196 | Fair 7.7% |
| Italians | 30.4 /100 | #197 | Fair 7.7% |
| Lithuanians | 30.0 /100 | #198 | Fair 7.8% |
| Immigrants | Poland | 27.3 /100 | #199 | Fair 7.8% |
| Guamanians/Chamorros | 25.5 /100 | #200 | Fair 7.8% |
| Basques | 24.7 /100 | #201 | Fair 7.8% |
| Sudanese | 23.5 /100 | #202 | Fair 7.8% |
| Spaniards | 23.3 /100 | #203 | Fair 7.8% |
| Lebanese | 22.2 /100 | #204 | Fair 7.8% |
| Immigrants | Immigrants | 21.4 /100 | #205 | Fair 7.8% |
| Hungarians | 21.2 /100 | #206 | Fair 7.8% |