Choctaw vs Yugoslavian Unemployment Among Ages 55 to 59 years
COMPARE
Choctaw
Yugoslavian
Unemployment Among Ages 55 to 59 years
Unemployment Among Ages 55 to 59 years Comparison
Choctaw
Yugoslavians
5.0%
UNEMPLOYMENT AMONG AGES 55 TO 59 YEARS
1.3/ 100
METRIC RATING
237th/ 347
METRIC RANK
4.7%
UNEMPLOYMENT AMONG AGES 55 TO 59 YEARS
94.7/ 100
METRIC RATING
99th/ 347
METRIC RANK
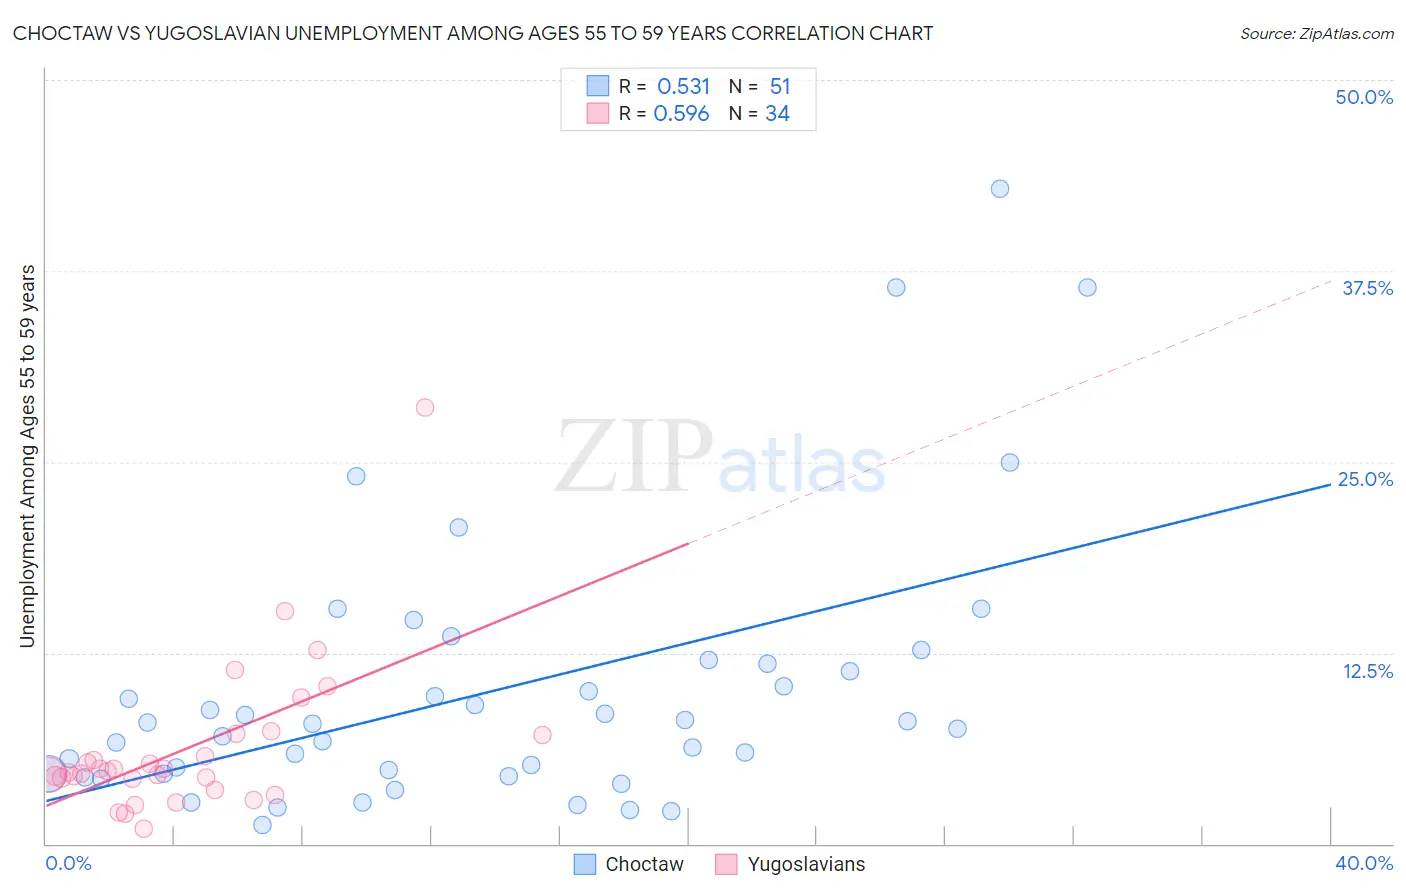
Choctaw vs Yugoslavian Unemployment Among Ages 55 to 59 years Correlation Chart
The statistical analysis conducted on geographies consisting of 252,000,407 people shows a substantial positive correlation between the proportion of Choctaw and unemployment rate among population between the ages 55 and 59 in the United States with a correlation coefficient (R) of 0.531 and weighted average of 5.0%. Similarly, the statistical analysis conducted on geographies consisting of 270,151,356 people shows a substantial positive correlation between the proportion of Yugoslavians and unemployment rate among population between the ages 55 and 59 in the United States with a correlation coefficient (R) of 0.596 and weighted average of 4.7%, a difference of 7.6%.
Unemployment Among Ages 55 to 59 years Correlation Summary
| Measurement | Choctaw | Yugoslavian |
| Minimum | 1.2% | 0.97% |
| Maximum | 42.9% | 28.6% |
| Range | 41.7% | 27.6% |
| Mean | 10.0% | 6.2% |
| Median | 7.9% | 4.7% |
| Interquartile 25% (IQ1) | 4.6% | 4.3% |
| Interquartile 75% (IQ3) | 11.8% | 7.1% |
| Interquartile Range (IQR) | 7.2% | 2.8% |
| Standard Deviation (Sample) | 8.9% | 5.0% |
| Standard Deviation (Population) | 8.8% | 5.0% |
Similar Demographics by Unemployment Among Ages 55 to 59 years
Demographics Similar to Choctaw by Unemployment Among Ages 55 to 59 years
In terms of unemployment among ages 55 to 59 years, the demographic groups most similar to Choctaw are Immigrants from Albania (5.0%, a difference of 0.010%), Moroccan (5.0%, a difference of 0.020%), French American Indian (5.0%, a difference of 0.040%), Immigrants from Hong Kong (5.0%, a difference of 0.11%), and Immigrants from Costa Rica (5.0%, a difference of 0.16%).
| Demographics | Rating | Rank | Unemployment Among Ages 55 to 59 years |
| Immigrants | Syria | 2.7 /100 | #230 | Tragic 5.0% |
| Cherokee | 2.6 /100 | #231 | Tragic 5.0% |
| Albanians | 2.5 /100 | #232 | Tragic 5.0% |
| Immigrants | Immigrants | 2.3 /100 | #233 | Tragic 5.0% |
| Immigrants | Southern Europe | 1.8 /100 | #234 | Tragic 5.0% |
| Immigrants | Hong Kong | 1.4 /100 | #235 | Tragic 5.0% |
| Immigrants | Albania | 1.3 /100 | #236 | Tragic 5.0% |
| Choctaw | 1.3 /100 | #237 | Tragic 5.0% |
| Moroccans | 1.3 /100 | #238 | Tragic 5.0% |
| French American Indians | 1.2 /100 | #239 | Tragic 5.0% |
| Immigrants | Costa Rica | 1.1 /100 | #240 | Tragic 5.0% |
| Brazilians | 1.0 /100 | #241 | Tragic 5.0% |
| Liberians | 0.9 /100 | #242 | Tragic 5.1% |
| Hondurans | 0.7 /100 | #243 | Tragic 5.1% |
| Immigrants | Fiji | 0.7 /100 | #244 | Tragic 5.1% |
Demographics Similar to Yugoslavians by Unemployment Among Ages 55 to 59 years
In terms of unemployment among ages 55 to 59 years, the demographic groups most similar to Yugoslavians are Immigrants from Germany (4.7%, a difference of 0.020%), Immigrants from Canada (4.7%, a difference of 0.040%), Immigrants from Belgium (4.7%, a difference of 0.050%), Serbian (4.7%, a difference of 0.070%), and Celtic (4.7%, a difference of 0.090%).
| Demographics | Rating | Rank | Unemployment Among Ages 55 to 59 years |
| Iraqis | 96.1 /100 | #92 | Exceptional 4.7% |
| Immigrants | England | 95.8 /100 | #93 | Exceptional 4.7% |
| Immigrants | Scotland | 95.7 /100 | #94 | Exceptional 4.7% |
| South Africans | 95.6 /100 | #95 | Exceptional 4.7% |
| Immigrants | Belgium | 95.0 /100 | #96 | Exceptional 4.7% |
| Immigrants | Canada | 94.9 /100 | #97 | Exceptional 4.7% |
| Immigrants | Germany | 94.8 /100 | #98 | Exceptional 4.7% |
| Yugoslavians | 94.7 /100 | #99 | Exceptional 4.7% |
| Serbians | 94.4 /100 | #100 | Exceptional 4.7% |
| Celtics | 94.3 /100 | #101 | Exceptional 4.7% |
| Canadians | 94.1 /100 | #102 | Exceptional 4.7% |
| Immigrants | Oceania | 94.0 /100 | #103 | Exceptional 4.7% |
| Immigrants | Turkey | 93.9 /100 | #104 | Exceptional 4.7% |
| Immigrants | North America | 93.9 /100 | #105 | Exceptional 4.7% |
| Immigrants | Laos | 93.9 /100 | #106 | Exceptional 4.7% |