Panamanian vs British West Indian Unemployment Among Ages 55 to 59 years
COMPARE
Panamanian
British West Indian
Unemployment Among Ages 55 to 59 years
Unemployment Among Ages 55 to 59 years Comparison
Panamanians
British West Indians
4.7%
UNEMPLOYMENT AMONG AGES 55 TO 59 YEARS
84.1/ 100
METRIC RATING
134th/ 347
METRIC RANK
5.3%
UNEMPLOYMENT AMONG AGES 55 TO 59 YEARS
0.0/ 100
METRIC RATING
292nd/ 347
METRIC RANK
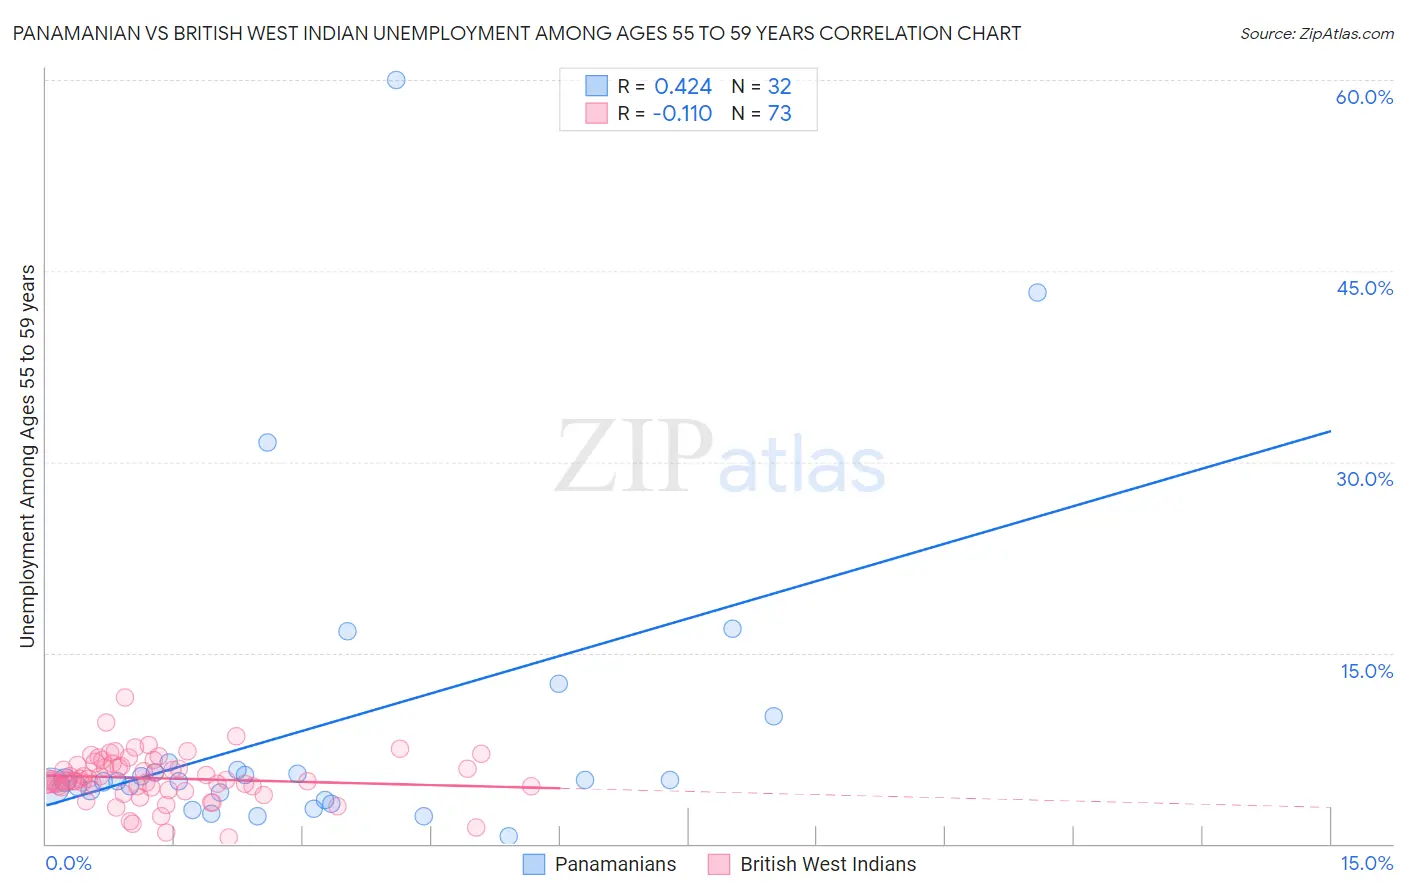
Panamanian vs British West Indian Unemployment Among Ages 55 to 59 years Correlation Chart
The statistical analysis conducted on geographies consisting of 268,443,115 people shows a moderate positive correlation between the proportion of Panamanians and unemployment rate among population between the ages 55 and 59 in the United States with a correlation coefficient (R) of 0.424 and weighted average of 4.7%. Similarly, the statistical analysis conducted on geographies consisting of 148,255,971 people shows a poor negative correlation between the proportion of British West Indians and unemployment rate among population between the ages 55 and 59 in the United States with a correlation coefficient (R) of -0.110 and weighted average of 5.3%, a difference of 12.1%.
Unemployment Among Ages 55 to 59 years Correlation Summary
| Measurement | Panamanian | British West Indian |
| Minimum | 0.60% | 0.50% |
| Maximum | 60.0% | 11.5% |
| Range | 59.4% | 11.0% |
| Mean | 9.2% | 5.1% |
| Median | 5.0% | 5.0% |
| Interquartile 25% (IQ1) | 3.7% | 4.4% |
| Interquartile 75% (IQ3) | 6.1% | 6.3% |
| Interquartile Range (IQR) | 2.4% | 1.8% |
| Standard Deviation (Sample) | 12.8% | 1.9% |
| Standard Deviation (Population) | 12.6% | 1.9% |
Similar Demographics by Unemployment Among Ages 55 to 59 years
Demographics Similar to Panamanians by Unemployment Among Ages 55 to 59 years
In terms of unemployment among ages 55 to 59 years, the demographic groups most similar to Panamanians are Immigrants from Netherlands (4.7%, a difference of 0.030%), Slavic (4.7%, a difference of 0.030%), Colombian (4.7%, a difference of 0.040%), Delaware (4.7%, a difference of 0.040%), and Immigrants from Romania (4.7%, a difference of 0.090%).
| Demographics | Rating | Rank | Unemployment Among Ages 55 to 59 years |
| Icelanders | 87.7 /100 | #127 | Excellent 4.7% |
| Pennsylvania Germans | 87.1 /100 | #128 | Excellent 4.7% |
| Immigrants | Sweden | 86.8 /100 | #129 | Excellent 4.7% |
| Greeks | 86.6 /100 | #130 | Excellent 4.7% |
| Immigrants | Thailand | 85.4 /100 | #131 | Excellent 4.7% |
| Immigrants | Romania | 85.3 /100 | #132 | Excellent 4.7% |
| Immigrants | Netherlands | 84.5 /100 | #133 | Excellent 4.7% |
| Panamanians | 84.1 /100 | #134 | Excellent 4.7% |
| Slavs | 83.7 /100 | #135 | Excellent 4.7% |
| Colombians | 83.6 /100 | #136 | Excellent 4.7% |
| Delaware | 83.6 /100 | #137 | Excellent 4.7% |
| Immigrants | Switzerland | 82.9 /100 | #138 | Excellent 4.7% |
| Romanians | 82.7 /100 | #139 | Excellent 4.7% |
| Immigrants | Indonesia | 80.2 /100 | #140 | Excellent 4.8% |
| French Canadians | 80.1 /100 | #141 | Excellent 4.8% |
Demographics Similar to British West Indians by Unemployment Among Ages 55 to 59 years
In terms of unemployment among ages 55 to 59 years, the demographic groups most similar to British West Indians are Trinidadian and Tobagonian (5.3%, a difference of 0.14%), Immigrants from Grenada (5.3%, a difference of 0.19%), Sioux (5.3%, a difference of 0.21%), Immigrants from Central America (5.3%, a difference of 0.24%), and Immigrants from Israel (5.3%, a difference of 0.30%).
| Demographics | Rating | Rank | Unemployment Among Ages 55 to 59 years |
| Armenians | 0.0 /100 | #285 | Tragic 5.3% |
| Immigrants | Ghana | 0.0 /100 | #286 | Tragic 5.3% |
| Immigrants | Guatemala | 0.0 /100 | #287 | Tragic 5.3% |
| Immigrants | Israel | 0.0 /100 | #288 | Tragic 5.3% |
| Immigrants | Central America | 0.0 /100 | #289 | Tragic 5.3% |
| Sioux | 0.0 /100 | #290 | Tragic 5.3% |
| Trinidadians and Tobagonians | 0.0 /100 | #291 | Tragic 5.3% |
| British West Indians | 0.0 /100 | #292 | Tragic 5.3% |
| Immigrants | Grenada | 0.0 /100 | #293 | Tragic 5.3% |
| Cajuns | 0.0 /100 | #294 | Tragic 5.3% |
| Dutch West Indians | 0.0 /100 | #295 | Tragic 5.3% |
| Barbadians | 0.0 /100 | #296 | Tragic 5.3% |
| Immigrants | Mexico | 0.0 /100 | #297 | Tragic 5.3% |
| Hispanics or Latinos | 0.0 /100 | #298 | Tragic 5.4% |
| Cape Verdeans | 0.0 /100 | #299 | Tragic 5.4% |