Panamanian vs Immigrants from Vietnam Unemployment Among Ages 55 to 59 years
COMPARE
Panamanian
Immigrants from Vietnam
Unemployment Among Ages 55 to 59 years
Unemployment Among Ages 55 to 59 years Comparison
Panamanians
Immigrants from Vietnam
4.7%
UNEMPLOYMENT AMONG AGES 55 TO 59 YEARS
84.1/ 100
METRIC RATING
134th/ 347
METRIC RANK
4.7%
UNEMPLOYMENT AMONG AGES 55 TO 59 YEARS
96.9/ 100
METRIC RATING
85th/ 347
METRIC RANK
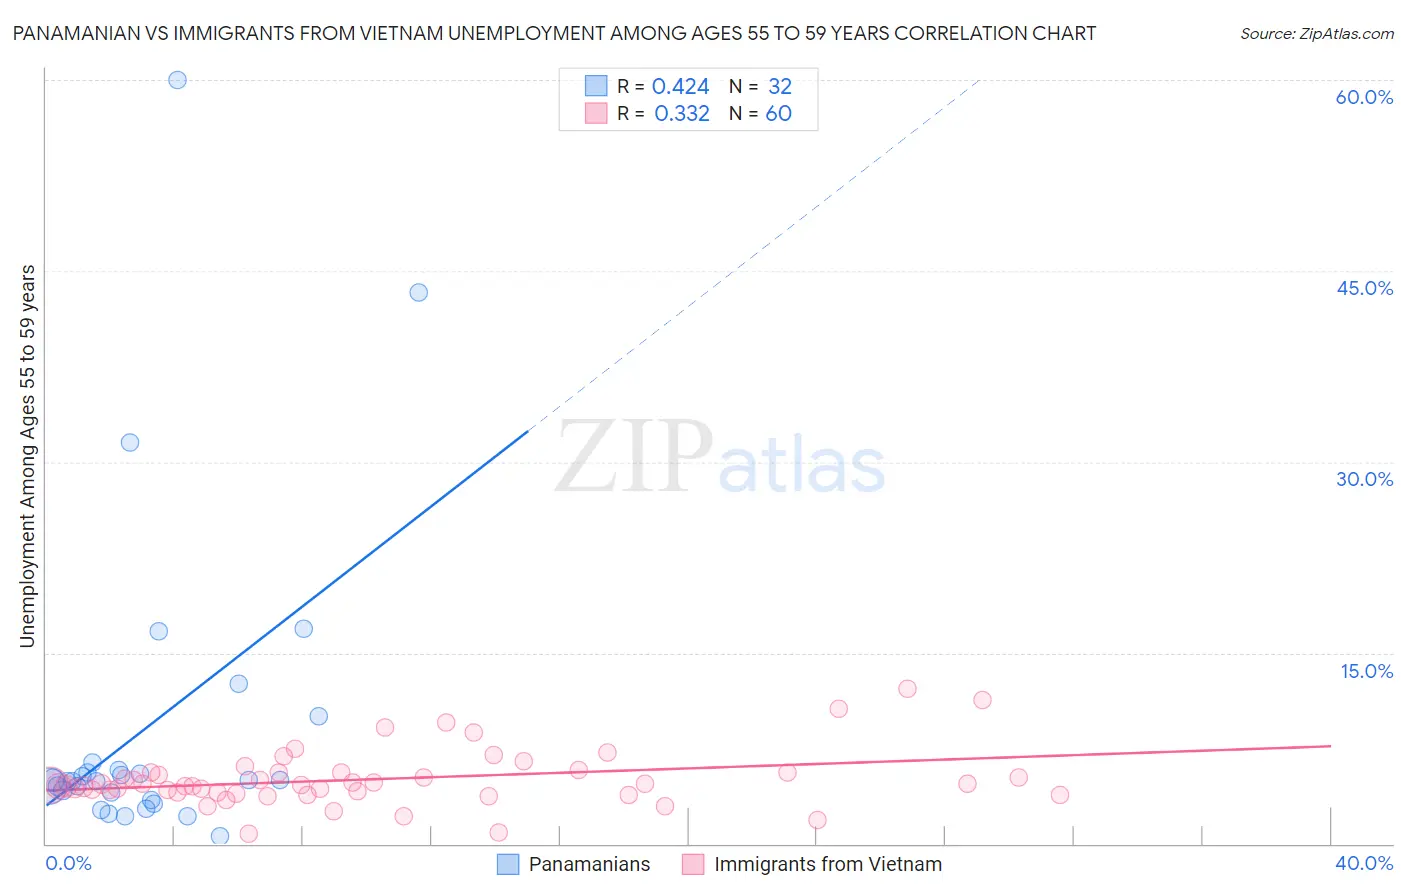
Panamanian vs Immigrants from Vietnam Unemployment Among Ages 55 to 59 years Correlation Chart
The statistical analysis conducted on geographies consisting of 268,443,115 people shows a moderate positive correlation between the proportion of Panamanians and unemployment rate among population between the ages 55 and 59 in the United States with a correlation coefficient (R) of 0.424 and weighted average of 4.7%. Similarly, the statistical analysis conducted on geographies consisting of 378,312,486 people shows a mild positive correlation between the proportion of Immigrants from Vietnam and unemployment rate among population between the ages 55 and 59 in the United States with a correlation coefficient (R) of 0.332 and weighted average of 4.7%, a difference of 1.9%.
Unemployment Among Ages 55 to 59 years Correlation Summary
| Measurement | Panamanian | Immigrants from Vietnam |
| Minimum | 0.60% | 0.80% |
| Maximum | 60.0% | 12.2% |
| Range | 59.4% | 11.4% |
| Mean | 9.2% | 5.1% |
| Median | 5.0% | 4.6% |
| Interquartile 25% (IQ1) | 3.7% | 4.1% |
| Interquartile 75% (IQ3) | 6.1% | 5.6% |
| Interquartile Range (IQR) | 2.4% | 1.5% |
| Standard Deviation (Sample) | 12.8% | 2.2% |
| Standard Deviation (Population) | 12.6% | 2.2% |
Similar Demographics by Unemployment Among Ages 55 to 59 years
Demographics Similar to Panamanians by Unemployment Among Ages 55 to 59 years
In terms of unemployment among ages 55 to 59 years, the demographic groups most similar to Panamanians are Immigrants from Netherlands (4.7%, a difference of 0.030%), Slavic (4.7%, a difference of 0.030%), Colombian (4.7%, a difference of 0.040%), Delaware (4.7%, a difference of 0.040%), and Immigrants from Romania (4.7%, a difference of 0.090%).
| Demographics | Rating | Rank | Unemployment Among Ages 55 to 59 years |
| Icelanders | 87.7 /100 | #127 | Excellent 4.7% |
| Pennsylvania Germans | 87.1 /100 | #128 | Excellent 4.7% |
| Immigrants | Sweden | 86.8 /100 | #129 | Excellent 4.7% |
| Greeks | 86.6 /100 | #130 | Excellent 4.7% |
| Immigrants | Thailand | 85.4 /100 | #131 | Excellent 4.7% |
| Immigrants | Romania | 85.3 /100 | #132 | Excellent 4.7% |
| Immigrants | Netherlands | 84.5 /100 | #133 | Excellent 4.7% |
| Panamanians | 84.1 /100 | #134 | Excellent 4.7% |
| Slavs | 83.7 /100 | #135 | Excellent 4.7% |
| Colombians | 83.6 /100 | #136 | Excellent 4.7% |
| Delaware | 83.6 /100 | #137 | Excellent 4.7% |
| Immigrants | Switzerland | 82.9 /100 | #138 | Excellent 4.7% |
| Romanians | 82.7 /100 | #139 | Excellent 4.7% |
| Immigrants | Indonesia | 80.2 /100 | #140 | Excellent 4.8% |
| French Canadians | 80.1 /100 | #141 | Excellent 4.8% |
Demographics Similar to Immigrants from Vietnam by Unemployment Among Ages 55 to 59 years
In terms of unemployment among ages 55 to 59 years, the demographic groups most similar to Immigrants from Vietnam are Malaysian (4.7%, a difference of 0.0%), Immigrants from Colombia (4.7%, a difference of 0.0%), Polish (4.7%, a difference of 0.030%), Immigrants from Cameroon (4.7%, a difference of 0.030%), and Irish (4.7%, a difference of 0.050%).
| Demographics | Rating | Rank | Unemployment Among Ages 55 to 59 years |
| Finns | 98.2 /100 | #78 | Exceptional 4.6% |
| Sri Lankans | 98.1 /100 | #79 | Exceptional 4.6% |
| Cambodians | 98.0 /100 | #80 | Exceptional 4.6% |
| Taiwanese | 97.9 /100 | #81 | Exceptional 4.6% |
| Latvians | 97.8 /100 | #82 | Exceptional 4.6% |
| Lebanese | 97.5 /100 | #83 | Exceptional 4.6% |
| Malaysians | 96.9 /100 | #84 | Exceptional 4.7% |
| Immigrants | Vietnam | 96.9 /100 | #85 | Exceptional 4.7% |
| Immigrants | Colombia | 96.9 /100 | #86 | Exceptional 4.7% |
| Poles | 96.9 /100 | #87 | Exceptional 4.7% |
| Immigrants | Cameroon | 96.9 /100 | #88 | Exceptional 4.7% |
| Irish | 96.8 /100 | #89 | Exceptional 4.7% |
| Immigrants | Poland | 96.4 /100 | #90 | Exceptional 4.7% |
| New Zealanders | 96.3 /100 | #91 | Exceptional 4.7% |
| Iraqis | 96.1 /100 | #92 | Exceptional 4.7% |