Romanian vs Pennsylvania German Unemployment Among Ages 65 to 74 years
COMPARE
Romanian
Pennsylvania German
Unemployment Among Ages 65 to 74 years
Unemployment Among Ages 65 to 74 years Comparison
Romanians
Pennsylvania Germans
5.2%
UNEMPLOYMENT AMONG AGES 65 TO 74 YEARS
97.4/ 100
METRIC RATING
91st/ 347
METRIC RANK
5.8%
UNEMPLOYMENT AMONG AGES 65 TO 74 YEARS
0.0/ 100
METRIC RATING
296th/ 347
METRIC RANK
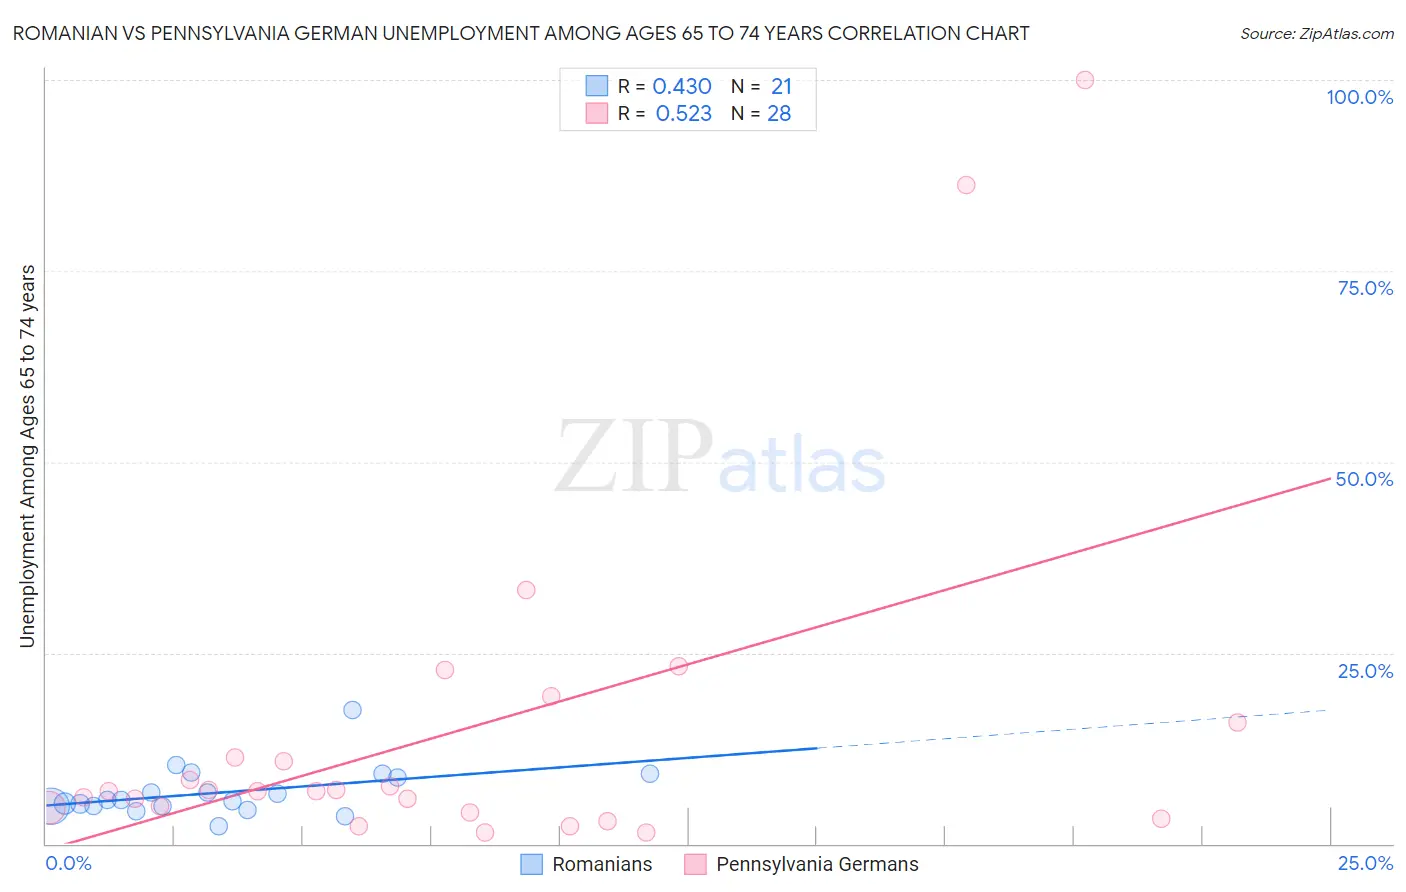
Romanian vs Pennsylvania German Unemployment Among Ages 65 to 74 years Correlation Chart
The statistical analysis conducted on geographies consisting of 334,573,451 people shows a moderate positive correlation between the proportion of Romanians and unemployment rate among population between the ages 65 and 74 in the United States with a correlation coefficient (R) of 0.430 and weighted average of 5.2%. Similarly, the statistical analysis conducted on geographies consisting of 205,280,371 people shows a substantial positive correlation between the proportion of Pennsylvania Germans and unemployment rate among population between the ages 65 and 74 in the United States with a correlation coefficient (R) of 0.523 and weighted average of 5.8%, a difference of 11.4%.
Unemployment Among Ages 65 to 74 years Correlation Summary
| Measurement | Romanian | Pennsylvania German |
| Minimum | 2.3% | 1.4% |
| Maximum | 17.5% | 100.0% |
| Range | 15.2% | 98.6% |
| Mean | 6.7% | 15.0% |
| Median | 5.7% | 6.9% |
| Interquartile 25% (IQ1) | 4.9% | 4.4% |
| Interquartile 75% (IQ3) | 8.9% | 13.6% |
| Interquartile Range (IQR) | 4.0% | 9.2% |
| Standard Deviation (Sample) | 3.2% | 23.4% |
| Standard Deviation (Population) | 3.2% | 23.0% |
Similar Demographics by Unemployment Among Ages 65 to 74 years
Demographics Similar to Romanians by Unemployment Among Ages 65 to 74 years
In terms of unemployment among ages 65 to 74 years, the demographic groups most similar to Romanians are Puget Sound Salish (5.2%, a difference of 0.030%), Immigrants from Netherlands (5.2%, a difference of 0.080%), Luxembourger (5.2%, a difference of 0.090%), South African (5.2%, a difference of 0.10%), and Serbian (5.2%, a difference of 0.11%).
| Demographics | Rating | Rank | Unemployment Among Ages 65 to 74 years |
| Immigrants | Hungary | 98.0 /100 | #84 | Exceptional 5.2% |
| British | 97.9 /100 | #85 | Exceptional 5.2% |
| Danes | 97.9 /100 | #86 | Exceptional 5.2% |
| Scottish | 97.9 /100 | #87 | Exceptional 5.2% |
| Immigrants | Saudi Arabia | 97.9 /100 | #88 | Exceptional 5.2% |
| English | 97.8 /100 | #89 | Exceptional 5.2% |
| Luxembourgers | 97.6 /100 | #90 | Exceptional 5.2% |
| Romanians | 97.4 /100 | #91 | Exceptional 5.2% |
| Puget Sound Salish | 97.3 /100 | #92 | Exceptional 5.2% |
| Immigrants | Netherlands | 97.1 /100 | #93 | Exceptional 5.2% |
| South Africans | 97.1 /100 | #94 | Exceptional 5.2% |
| Serbians | 97.0 /100 | #95 | Exceptional 5.2% |
| Immigrants | Thailand | 97.0 /100 | #96 | Exceptional 5.2% |
| Senegalese | 96.5 /100 | #97 | Exceptional 5.2% |
| Welsh | 96.5 /100 | #98 | Exceptional 5.2% |
Demographics Similar to Pennsylvania Germans by Unemployment Among Ages 65 to 74 years
In terms of unemployment among ages 65 to 74 years, the demographic groups most similar to Pennsylvania Germans are Houma (5.8%, a difference of 0.17%), Immigrants from Latin America (5.8%, a difference of 0.36%), Barbadian (5.8%, a difference of 0.37%), Ecuadorian (5.8%, a difference of 0.38%), and Black/African American (5.8%, a difference of 0.46%).
| Demographics | Rating | Rank | Unemployment Among Ages 65 to 74 years |
| Immigrants | Somalia | 0.0 /100 | #289 | Tragic 5.7% |
| Spanish American Indians | 0.0 /100 | #290 | Tragic 5.7% |
| Portuguese | 0.0 /100 | #291 | Tragic 5.7% |
| U.S. Virgin Islanders | 0.0 /100 | #292 | Tragic 5.8% |
| Immigrants | Grenada | 0.0 /100 | #293 | Tragic 5.8% |
| Immigrants | Morocco | 0.0 /100 | #294 | Tragic 5.8% |
| Blacks/African Americans | 0.0 /100 | #295 | Tragic 5.8% |
| Pennsylvania Germans | 0.0 /100 | #296 | Tragic 5.8% |
| Houma | 0.0 /100 | #297 | Tragic 5.8% |
| Immigrants | Latin America | 0.0 /100 | #298 | Tragic 5.8% |
| Barbadians | 0.0 /100 | #299 | Tragic 5.8% |
| Ecuadorians | 0.0 /100 | #300 | Tragic 5.8% |
| Armenians | 0.0 /100 | #301 | Tragic 5.8% |
| Liberians | 0.0 /100 | #302 | Tragic 5.8% |
| Arapaho | 0.0 /100 | #303 | Tragic 5.8% |