Palestinian vs Ecuadorian Unemployment Among Ages 30 to 34 years
COMPARE
Palestinian
Ecuadorian
Unemployment Among Ages 30 to 34 years
Unemployment Among Ages 30 to 34 years Comparison
Palestinians
Ecuadorians
5.4%
UNEMPLOYMENT AMONG AGES 30 TO 34 YEARS
75.1/ 100
METRIC RATING
135th/ 347
METRIC RANK
6.3%
UNEMPLOYMENT AMONG AGES 30 TO 34 YEARS
0.0/ 100
METRIC RATING
275th/ 347
METRIC RANK
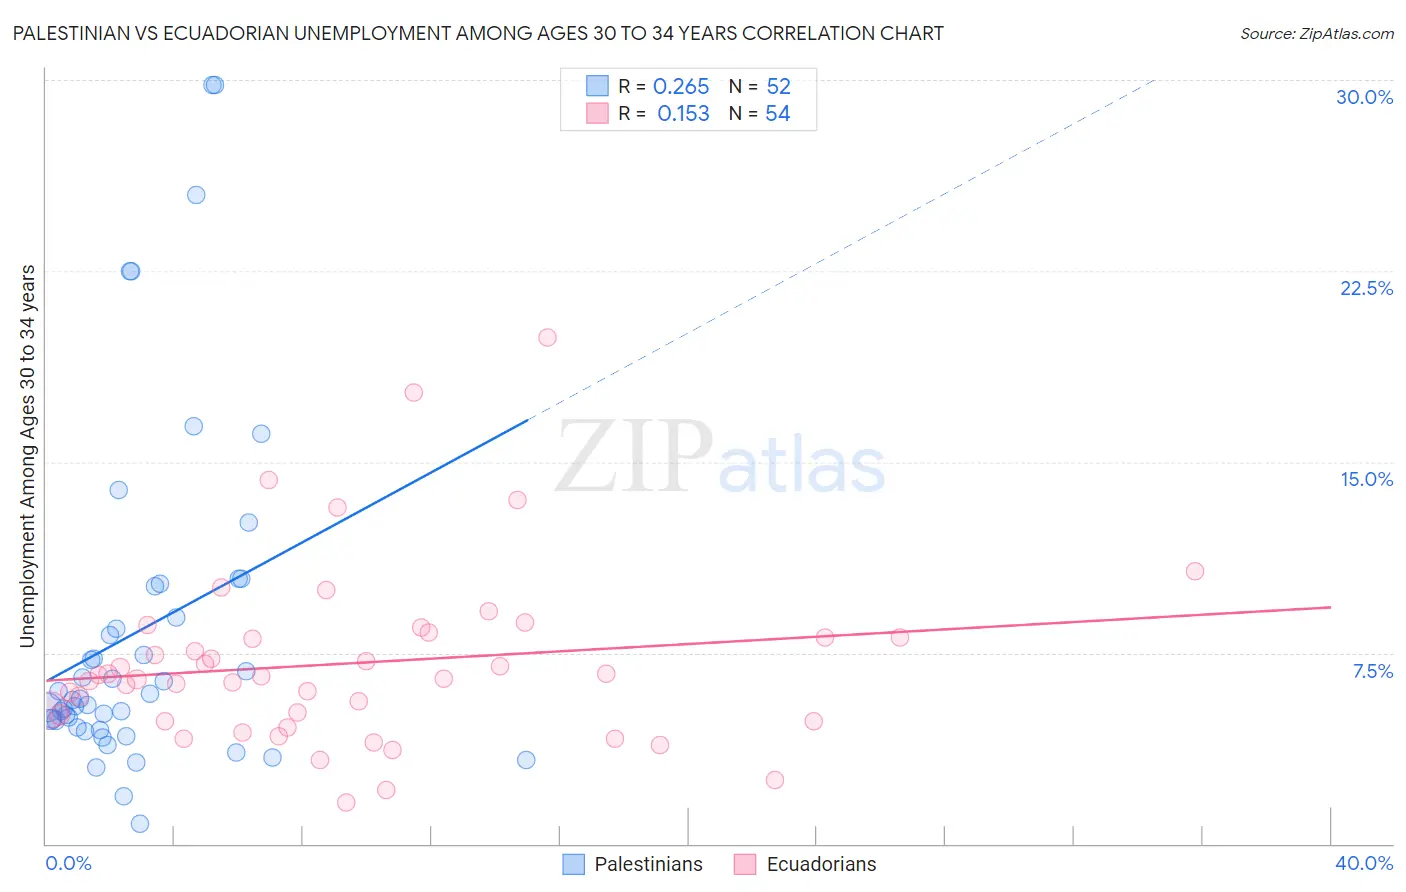
Palestinian vs Ecuadorian Unemployment Among Ages 30 to 34 years Correlation Chart
The statistical analysis conducted on geographies consisting of 210,568,596 people shows a weak positive correlation between the proportion of Palestinians and unemployment rate among population between the ages 30 and 34 in the United States with a correlation coefficient (R) of 0.265 and weighted average of 5.4%. Similarly, the statistical analysis conducted on geographies consisting of 305,085,687 people shows a poor positive correlation between the proportion of Ecuadorians and unemployment rate among population between the ages 30 and 34 in the United States with a correlation coefficient (R) of 0.153 and weighted average of 6.3%, a difference of 17.3%.
Unemployment Among Ages 30 to 34 years Correlation Summary
| Measurement | Palestinian | Ecuadorian |
| Minimum | 0.80% | 1.6% |
| Maximum | 29.8% | 19.9% |
| Range | 29.0% | 18.3% |
| Mean | 8.3% | 7.1% |
| Median | 5.7% | 6.5% |
| Interquartile 25% (IQ1) | 4.7% | 4.8% |
| Interquartile 75% (IQ3) | 9.5% | 8.1% |
| Interquartile Range (IQR) | 4.8% | 3.3% |
| Standard Deviation (Sample) | 6.7% | 3.5% |
| Standard Deviation (Population) | 6.6% | 3.5% |
Similar Demographics by Unemployment Among Ages 30 to 34 years
Demographics Similar to Palestinians by Unemployment Among Ages 30 to 34 years
In terms of unemployment among ages 30 to 34 years, the demographic groups most similar to Palestinians are Pakistani (5.4%, a difference of 0.050%), Immigrants from Canada (5.4%, a difference of 0.050%), Bangladeshi (5.3%, a difference of 0.14%), Serbian (5.4%, a difference of 0.20%), and Carpatho Rusyn (5.3%, a difference of 0.21%).
| Demographics | Rating | Rank | Unemployment Among Ages 30 to 34 years |
| Immigrants | Uruguay | 79.3 /100 | #128 | Good 5.3% |
| Poles | 78.8 /100 | #129 | Good 5.3% |
| Germans | 77.8 /100 | #130 | Good 5.3% |
| Immigrants | Eastern Europe | 77.4 /100 | #131 | Good 5.3% |
| Carpatho Rusyns | 77.3 /100 | #132 | Good 5.3% |
| Immigrants | Northern Europe | 77.3 /100 | #133 | Good 5.3% |
| Bangladeshis | 76.6 /100 | #134 | Good 5.3% |
| Palestinians | 75.1 /100 | #135 | Good 5.4% |
| Pakistanis | 74.6 /100 | #136 | Good 5.4% |
| Immigrants | Canada | 74.6 /100 | #137 | Good 5.4% |
| Serbians | 72.9 /100 | #138 | Good 5.4% |
| Lithuanians | 72.4 /100 | #139 | Good 5.4% |
| Immigrants | North America | 72.2 /100 | #140 | Good 5.4% |
| Immigrants | Europe | 72.1 /100 | #141 | Good 5.4% |
| Immigrants | Greece | 72.0 /100 | #142 | Good 5.4% |
Demographics Similar to Ecuadorians by Unemployment Among Ages 30 to 34 years
In terms of unemployment among ages 30 to 34 years, the demographic groups most similar to Ecuadorians are Pennsylvania German (6.3%, a difference of 0.050%), U.S. Virgin Islander (6.3%, a difference of 0.10%), Ottawa (6.3%, a difference of 0.11%), Blackfeet (6.3%, a difference of 0.13%), and Comanche (6.3%, a difference of 0.24%).
| Demographics | Rating | Rank | Unemployment Among Ages 30 to 34 years |
| Immigrants | Haiti | 0.0 /100 | #268 | Tragic 6.2% |
| French American Indians | 0.0 /100 | #269 | Tragic 6.3% |
| Immigrants | Senegal | 0.0 /100 | #270 | Tragic 6.3% |
| Comanche | 0.0 /100 | #271 | Tragic 6.3% |
| Blackfeet | 0.0 /100 | #272 | Tragic 6.3% |
| Ottawa | 0.0 /100 | #273 | Tragic 6.3% |
| U.S. Virgin Islanders | 0.0 /100 | #274 | Tragic 6.3% |
| Ecuadorians | 0.0 /100 | #275 | Tragic 6.3% |
| Pennsylvania Germans | 0.0 /100 | #276 | Tragic 6.3% |
| Immigrants | Ecuador | 0.0 /100 | #277 | Tragic 6.3% |
| Osage | 0.0 /100 | #278 | Tragic 6.3% |
| Cree | 0.0 /100 | #279 | Tragic 6.4% |
| Cherokee | 0.0 /100 | #280 | Tragic 6.4% |
| Immigrants | Caribbean | 0.0 /100 | #281 | Tragic 6.4% |
| Africans | 0.0 /100 | #282 | Tragic 6.4% |