Palestinian vs Immigrants from Italy Unemployment Among Ages 30 to 34 years
COMPARE
Palestinian
Immigrants from Italy
Unemployment Among Ages 30 to 34 years
Unemployment Among Ages 30 to 34 years Comparison
Palestinians
Immigrants from Italy
5.4%
UNEMPLOYMENT AMONG AGES 30 TO 34 YEARS
75.1/ 100
METRIC RATING
135th/ 347
METRIC RANK
5.3%
UNEMPLOYMENT AMONG AGES 30 TO 34 YEARS
81.1/ 100
METRIC RATING
123rd/ 347
METRIC RANK
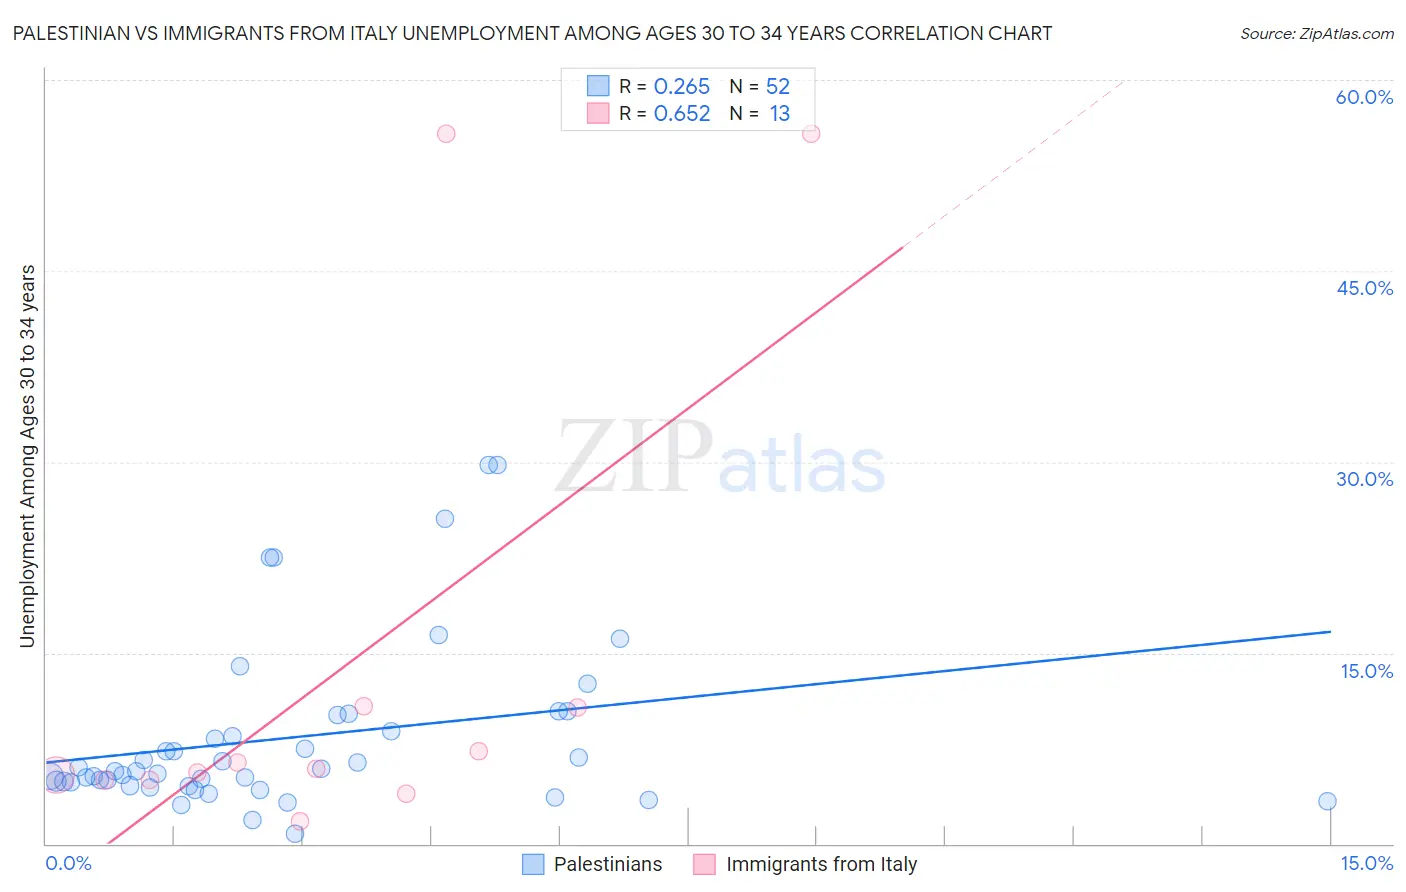
Palestinian vs Immigrants from Italy Unemployment Among Ages 30 to 34 years Correlation Chart
The statistical analysis conducted on geographies consisting of 210,568,596 people shows a weak positive correlation between the proportion of Palestinians and unemployment rate among population between the ages 30 and 34 in the United States with a correlation coefficient (R) of 0.265 and weighted average of 5.4%. Similarly, the statistical analysis conducted on geographies consisting of 307,180,999 people shows a significant positive correlation between the proportion of Immigrants from Italy and unemployment rate among population between the ages 30 and 34 in the United States with a correlation coefficient (R) of 0.652 and weighted average of 5.3%, a difference of 0.63%.
Unemployment Among Ages 30 to 34 years Correlation Summary
| Measurement | Palestinian | Immigrants from Italy |
| Minimum | 0.80% | 1.8% |
| Maximum | 29.8% | 55.8% |
| Range | 29.0% | 54.0% |
| Mean | 8.3% | 13.8% |
| Median | 5.7% | 5.9% |
| Interquartile 25% (IQ1) | 4.7% | 5.0% |
| Interquartile 75% (IQ3) | 9.5% | 10.8% |
| Interquartile Range (IQR) | 4.8% | 5.8% |
| Standard Deviation (Sample) | 6.7% | 18.8% |
| Standard Deviation (Population) | 6.6% | 18.1% |
Demographics Similar to Palestinians and Immigrants from Italy by Unemployment Among Ages 30 to 34 years
In terms of unemployment among ages 30 to 34 years, the demographic groups most similar to Palestinians are Pakistani (5.4%, a difference of 0.050%), Immigrants from Canada (5.4%, a difference of 0.050%), Bangladeshi (5.3%, a difference of 0.14%), Serbian (5.4%, a difference of 0.20%), and Carpatho Rusyn (5.3%, a difference of 0.21%). Similarly, the demographic groups most similar to Immigrants from Italy are Immigrants from Brazil (5.3%, a difference of 0.030%), Greek (5.3%, a difference of 0.080%), Immigrants from Netherlands (5.3%, a difference of 0.090%), Immigrants from Sri Lanka (5.3%, a difference of 0.10%), and Romanian (5.3%, a difference of 0.14%).
| Demographics | Rating | Rank | Unemployment Among Ages 30 to 34 years |
| New Zealanders | 82.5 /100 | #119 | Excellent 5.3% |
| Immigrants | Poland | 82.4 /100 | #120 | Excellent 5.3% |
| Romanians | 82.3 /100 | #121 | Excellent 5.3% |
| Immigrants | Netherlands | 81.8 /100 | #122 | Excellent 5.3% |
| Immigrants | Italy | 81.1 /100 | #123 | Excellent 5.3% |
| Immigrants | Brazil | 80.8 /100 | #124 | Excellent 5.3% |
| Greeks | 80.4 /100 | #125 | Excellent 5.3% |
| Immigrants | Sri Lanka | 80.2 /100 | #126 | Excellent 5.3% |
| Taiwanese | 79.4 /100 | #127 | Good 5.3% |
| Immigrants | Uruguay | 79.3 /100 | #128 | Good 5.3% |
| Poles | 78.8 /100 | #129 | Good 5.3% |
| Germans | 77.8 /100 | #130 | Good 5.3% |
| Immigrants | Eastern Europe | 77.4 /100 | #131 | Good 5.3% |
| Carpatho Rusyns | 77.3 /100 | #132 | Good 5.3% |
| Immigrants | Northern Europe | 77.3 /100 | #133 | Good 5.3% |
| Bangladeshis | 76.6 /100 | #134 | Good 5.3% |
| Palestinians | 75.1 /100 | #135 | Good 5.4% |
| Pakistanis | 74.6 /100 | #136 | Good 5.4% |
| Immigrants | Canada | 74.6 /100 | #137 | Good 5.4% |
| Serbians | 72.9 /100 | #138 | Good 5.4% |
| Lithuanians | 72.4 /100 | #139 | Good 5.4% |