Paiute vs Polish Unemployment Among Women with Children Ages 6 to 17 years
COMPARE
Paiute
Polish
Unemployment Among Women with Children Ages 6 to 17 years
Unemployment Among Women with Children Ages 6 to 17 years Comparison
Paiute
Poles
8.5%
UNEMPLOYMENT AMONG WOMEN WITH CHILDREN AGES 6 TO 17 YEARS
99.1/ 100
METRIC RATING
89th/ 347
METRIC RANK
9.4%
UNEMPLOYMENT AMONG WOMEN WITH CHILDREN AGES 6 TO 17 YEARS
1.5/ 100
METRIC RATING
247th/ 347
METRIC RANK
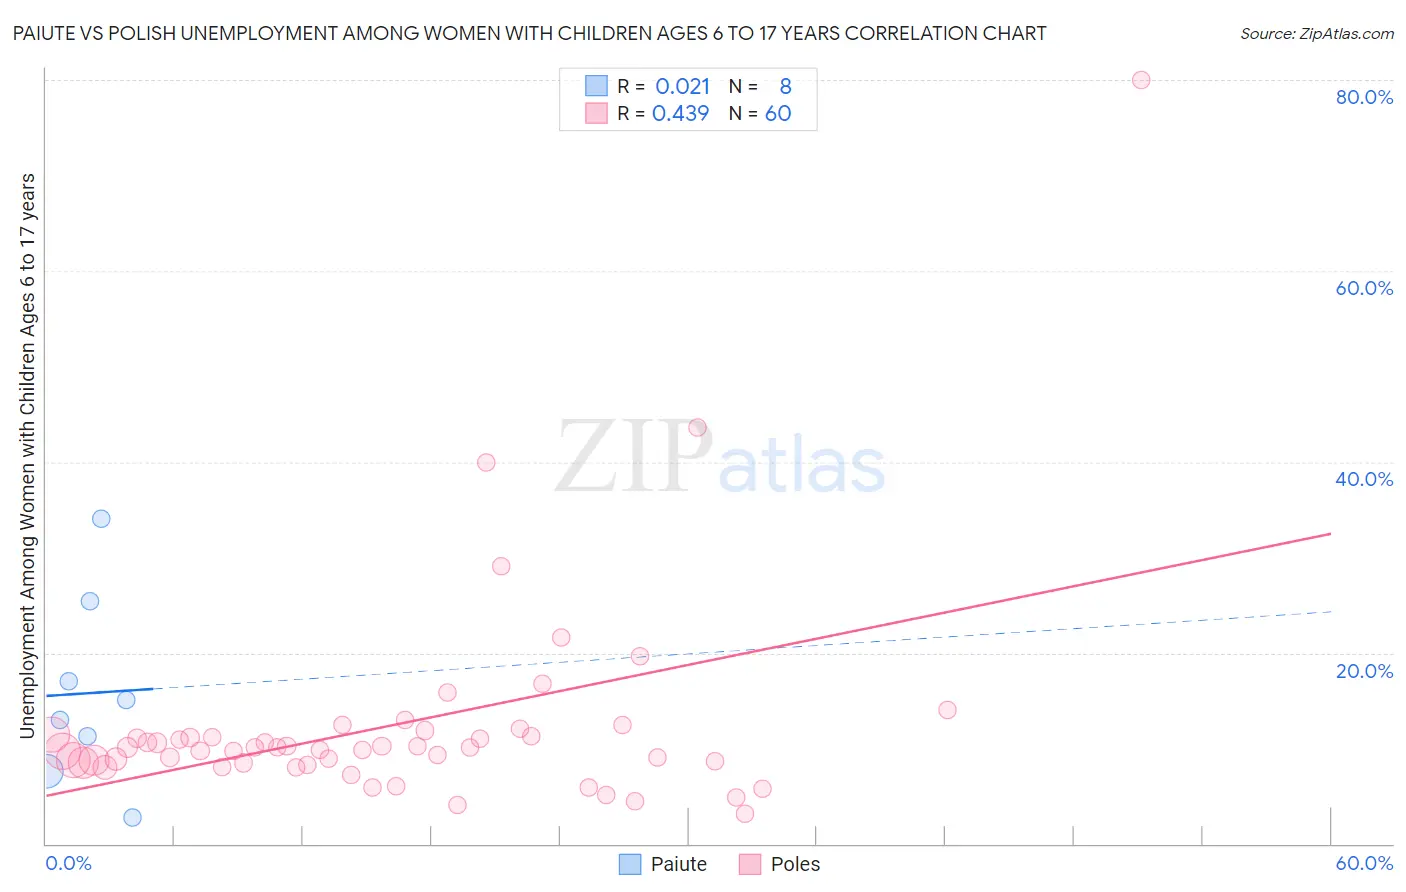
Paiute vs Polish Unemployment Among Women with Children Ages 6 to 17 years Correlation Chart
The statistical analysis conducted on geographies consisting of 53,618,284 people shows no correlation between the proportion of Paiute and unemployment rate among women with children between the ages 6 and 17 in the United States with a correlation coefficient (R) of 0.021 and weighted average of 8.5%. Similarly, the statistical analysis conducted on geographies consisting of 352,978,208 people shows a moderate positive correlation between the proportion of Poles and unemployment rate among women with children between the ages 6 and 17 in the United States with a correlation coefficient (R) of 0.439 and weighted average of 9.4%, a difference of 10.3%.
Unemployment Among Women with Children Ages 6 to 17 years Correlation Summary
| Measurement | Paiute | Polish |
| Minimum | 2.8% | 3.2% |
| Maximum | 34.1% | 80.0% |
| Range | 31.3% | 76.8% |
| Mean | 15.8% | 12.4% |
| Median | 14.0% | 10.1% |
| Interquartile 25% (IQ1) | 9.4% | 8.5% |
| Interquartile 75% (IQ3) | 21.2% | 11.4% |
| Interquartile Range (IQR) | 11.8% | 2.9% |
| Standard Deviation (Sample) | 10.0% | 11.3% |
| Standard Deviation (Population) | 9.3% | 11.2% |
Similar Demographics by Unemployment Among Women with Children Ages 6 to 17 years
Demographics Similar to Paiute by Unemployment Among Women with Children Ages 6 to 17 years
In terms of unemployment among women with children ages 6 to 17 years, the demographic groups most similar to Paiute are Yugoslavian (8.5%, a difference of 0.040%), Immigrants from Vietnam (8.5%, a difference of 0.080%), Immigrants from Israel (8.5%, a difference of 0.10%), Immigrants from Eastern Europe (8.5%, a difference of 0.10%), and Potawatomi (8.5%, a difference of 0.13%).
| Demographics | Rating | Rank | Unemployment Among Women with Children Ages 6 to 17 years |
| Cypriots | 99.6 /100 | #82 | Exceptional 8.4% |
| Bulgarians | 99.5 /100 | #83 | Exceptional 8.4% |
| Japanese | 99.5 /100 | #84 | Exceptional 8.4% |
| Immigrants | North Macedonia | 99.4 /100 | #85 | Exceptional 8.5% |
| Alaskan Athabascans | 99.4 /100 | #86 | Exceptional 8.5% |
| Immigrants | Israel | 99.1 /100 | #87 | Exceptional 8.5% |
| Immigrants | Vietnam | 99.1 /100 | #88 | Exceptional 8.5% |
| Paiute | 99.1 /100 | #89 | Exceptional 8.5% |
| Yugoslavians | 99.0 /100 | #90 | Exceptional 8.5% |
| Immigrants | Eastern Europe | 99.0 /100 | #91 | Exceptional 8.5% |
| Potawatomi | 99.0 /100 | #92 | Exceptional 8.5% |
| Australians | 98.9 /100 | #93 | Exceptional 8.5% |
| Immigrants | Barbados | 98.8 /100 | #94 | Exceptional 8.5% |
| Sri Lankans | 98.7 /100 | #95 | Exceptional 8.5% |
| German Russians | 98.6 /100 | #96 | Exceptional 8.5% |
Demographics Similar to Poles by Unemployment Among Women with Children Ages 6 to 17 years
In terms of unemployment among women with children ages 6 to 17 years, the demographic groups most similar to Poles are Immigrants from Africa (9.4%, a difference of 0.030%), Dutch (9.4%, a difference of 0.040%), Immigrants from South America (9.4%, a difference of 0.050%), Immigrants from Guatemala (9.4%, a difference of 0.14%), and Central American (9.4%, a difference of 0.15%).
| Demographics | Rating | Rank | Unemployment Among Women with Children Ages 6 to 17 years |
| Guatemalans | 2.3 /100 | #240 | Tragic 9.3% |
| Colombians | 2.2 /100 | #241 | Tragic 9.3% |
| Immigrants | Colombia | 2.1 /100 | #242 | Tragic 9.3% |
| Scottish | 2.0 /100 | #243 | Tragic 9.4% |
| English | 1.9 /100 | #244 | Tragic 9.4% |
| Immigrants | Cameroon | 1.8 /100 | #245 | Tragic 9.4% |
| Immigrants | Africa | 1.6 /100 | #246 | Tragic 9.4% |
| Poles | 1.5 /100 | #247 | Tragic 9.4% |
| Dutch | 1.5 /100 | #248 | Tragic 9.4% |
| Immigrants | South America | 1.5 /100 | #249 | Tragic 9.4% |
| Immigrants | Guatemala | 1.3 /100 | #250 | Tragic 9.4% |
| Central Americans | 1.3 /100 | #251 | Tragic 9.4% |
| Creek | 1.2 /100 | #252 | Tragic 9.4% |
| Portuguese | 1.1 /100 | #253 | Tragic 9.4% |
| Nicaraguans | 1.0 /100 | #254 | Tragic 9.4% |