Immigrants from St. Vincent and the Grenadines vs Bahamian Male Unemployment
COMPARE
Immigrants from St. Vincent and the Grenadines
Bahamian
Male Unemployment
Male Unemployment Comparison
Immigrants from St. Vincent and the Grenadines
Bahamians
7.5%
MALE UNEMPLOYMENT
0.0/ 100
METRIC RATING
321st/ 347
METRIC RANK
5.9%
MALE UNEMPLOYMENT
0.0/ 100
METRIC RATING
266th/ 347
METRIC RANK
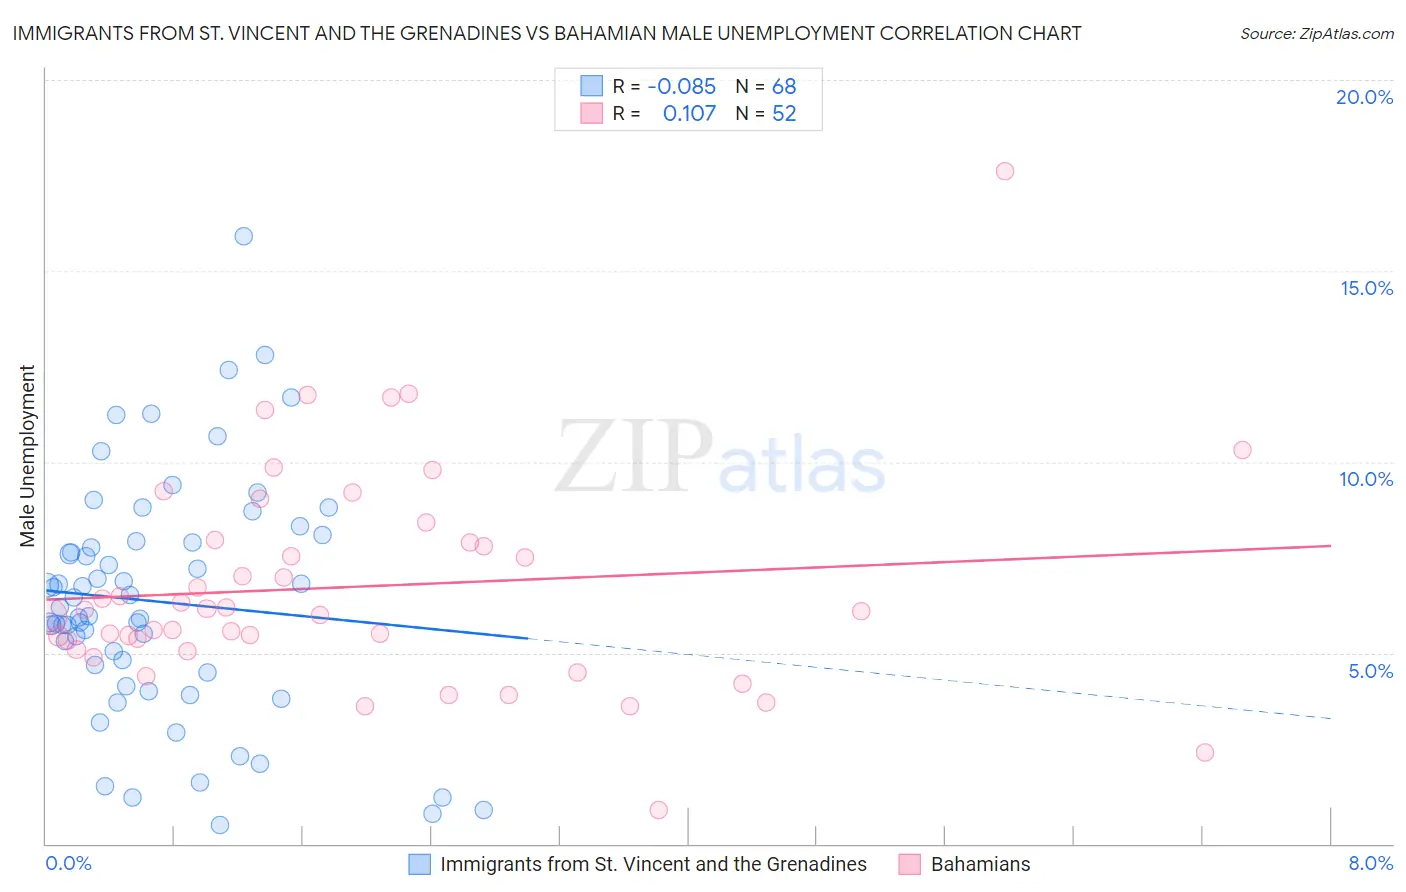
Immigrants from St. Vincent and the Grenadines vs Bahamian Male Unemployment Correlation Chart
The statistical analysis conducted on geographies consisting of 56,141,446 people shows a slight negative correlation between the proportion of Immigrants from St. Vincent and the Grenadines and unemployment rate among males in the United States with a correlation coefficient (R) of -0.085 and weighted average of 7.5%. Similarly, the statistical analysis conducted on geographies consisting of 112,565,011 people shows a poor positive correlation between the proportion of Bahamians and unemployment rate among males in the United States with a correlation coefficient (R) of 0.107 and weighted average of 5.9%, a difference of 26.2%.
Male Unemployment Correlation Summary
| Measurement | Immigrants from St. Vincent and the Grenadines | Bahamian |
| Minimum | 0.50% | 0.90% |
| Maximum | 15.9% | 17.6% |
| Range | 15.4% | 16.7% |
| Mean | 6.3% | 6.7% |
| Median | 6.1% | 6.1% |
| Interquartile 25% (IQ1) | 4.6% | 5.2% |
| Interquartile 75% (IQ3) | 7.9% | 7.9% |
| Interquartile Range (IQR) | 3.3% | 2.7% |
| Standard Deviation (Sample) | 3.1% | 2.9% |
| Standard Deviation (Population) | 3.1% | 2.8% |
Similar Demographics by Male Unemployment
Demographics Similar to Immigrants from St. Vincent and the Grenadines by Male Unemployment
In terms of male unemployment, the demographic groups most similar to Immigrants from St. Vincent and the Grenadines are Immigrants from Cabo Verde (7.5%, a difference of 0.33%), Immigrants from Grenada (7.6%, a difference of 1.1%), Colville (7.4%, a difference of 1.4%), Dominican (7.6%, a difference of 1.4%), and Shoshone (7.6%, a difference of 1.8%).
| Demographics | Rating | Rank | Male Unemployment |
| Immigrants | Barbados | 0.0 /100 | #314 | Tragic 7.1% |
| Houma | 0.0 /100 | #315 | Tragic 7.1% |
| Immigrants | Guyana | 0.0 /100 | #316 | Tragic 7.1% |
| Guyanese | 0.0 /100 | #317 | Tragic 7.1% |
| Cape Verdeans | 0.0 /100 | #318 | Tragic 7.1% |
| British West Indians | 0.0 /100 | #319 | Tragic 7.3% |
| Colville | 0.0 /100 | #320 | Tragic 7.4% |
| Immigrants | St. Vincent and the Grenadines | 0.0 /100 | #321 | Tragic 7.5% |
| Immigrants | Cabo Verde | 0.0 /100 | #322 | Tragic 7.5% |
| Immigrants | Grenada | 0.0 /100 | #323 | Tragic 7.6% |
| Dominicans | 0.0 /100 | #324 | Tragic 7.6% |
| Shoshone | 0.0 /100 | #325 | Tragic 7.6% |
| Immigrants | Dominican Republic | 0.0 /100 | #326 | Tragic 7.6% |
| Paiute | 0.0 /100 | #327 | Tragic 7.7% |
| Natives/Alaskans | 0.0 /100 | #328 | Tragic 7.7% |
Demographics Similar to Bahamians by Male Unemployment
In terms of male unemployment, the demographic groups most similar to Bahamians are Nigerian (5.9%, a difference of 0.12%), French American Indian (5.9%, a difference of 0.14%), Bermudan (5.9%, a difference of 0.33%), Immigrants from Mexico (5.9%, a difference of 0.52%), and Immigrants from Nigeria (6.0%, a difference of 0.60%).
| Demographics | Rating | Rank | Male Unemployment |
| Cajuns | 0.1 /100 | #259 | Tragic 5.8% |
| Immigrants | Central America | 0.1 /100 | #260 | Tragic 5.8% |
| Liberians | 0.1 /100 | #261 | Tragic 5.8% |
| Immigrants | Portugal | 0.1 /100 | #262 | Tragic 5.9% |
| Immigrants | Latin America | 0.1 /100 | #263 | Tragic 5.9% |
| Immigrants | Mexico | 0.0 /100 | #264 | Tragic 5.9% |
| French American Indians | 0.0 /100 | #265 | Tragic 5.9% |
| Bahamians | 0.0 /100 | #266 | Tragic 5.9% |
| Nigerians | 0.0 /100 | #267 | Tragic 5.9% |
| Bermudans | 0.0 /100 | #268 | Tragic 5.9% |
| Immigrants | Nigeria | 0.0 /100 | #269 | Tragic 6.0% |
| Sub-Saharan Africans | 0.0 /100 | #270 | Tragic 6.0% |
| Blackfeet | 0.0 /100 | #271 | Tragic 6.0% |
| Immigrants | Uzbekistan | 0.0 /100 | #272 | Tragic 6.0% |
| Armenians | 0.0 /100 | #273 | Tragic 6.0% |