Norwegian vs Immigrants from Uzbekistan Unemployment Among Women with Children Under 18 years
COMPARE
Norwegian
Immigrants from Uzbekistan
Unemployment Among Women with Children Under 18 years
Unemployment Among Women with Children Under 18 years Comparison
Norwegians
Immigrants from Uzbekistan
4.4%
UNEMPLOYMENT AMONG WOMEN WITH CHILDREN UNDER 18 YEARS
100.0/ 100
METRIC RATING
1st/ 347
METRIC RANK
5.4%
UNEMPLOYMENT AMONG WOMEN WITH CHILDREN UNDER 18 YEARS
50.0/ 100
METRIC RATING
174th/ 347
METRIC RANK
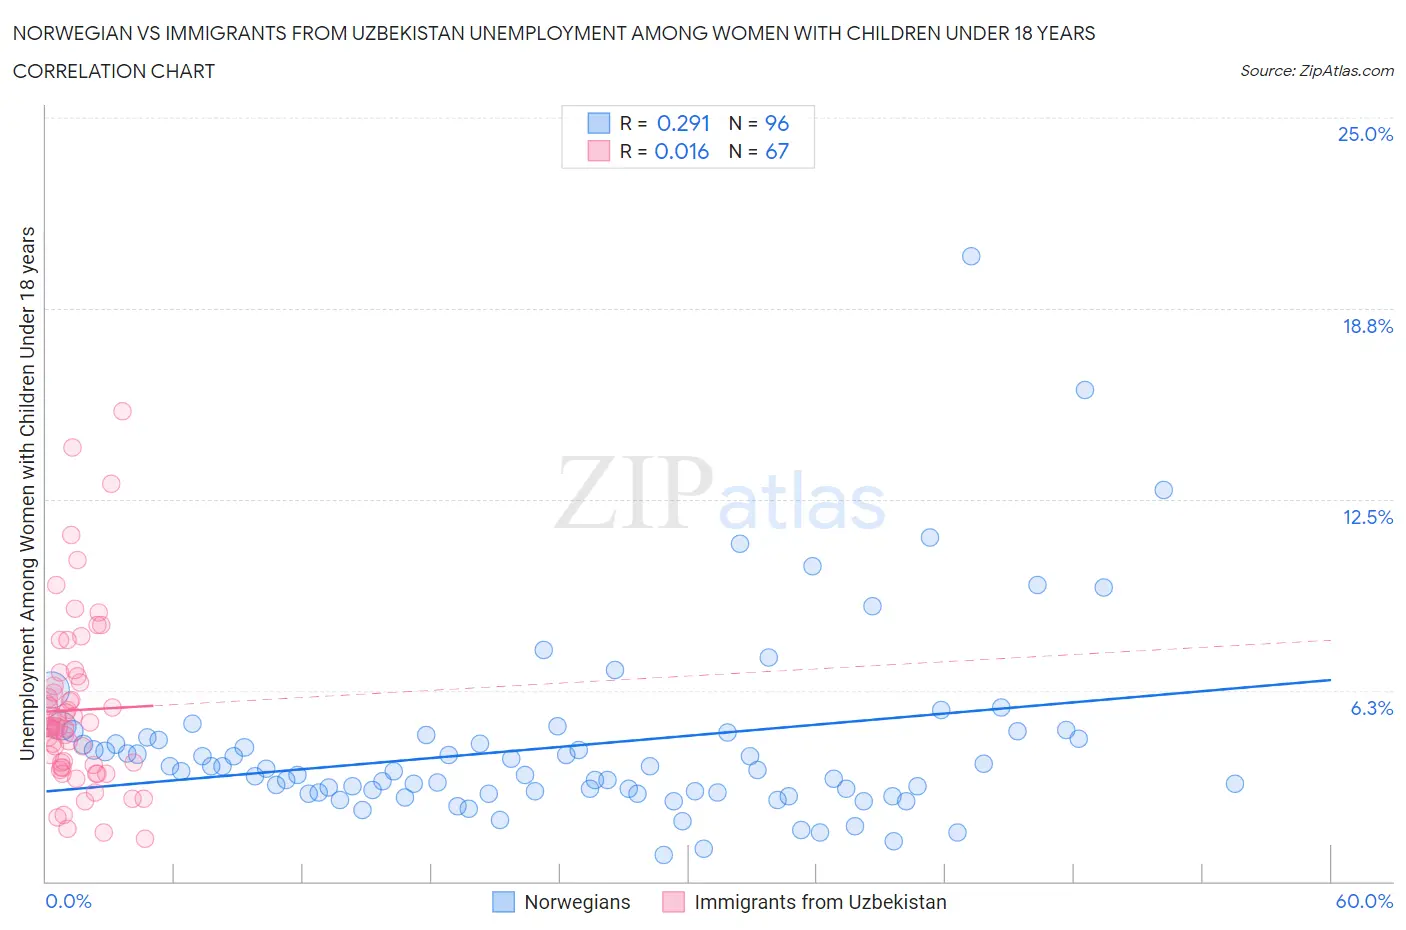
Norwegian vs Immigrants from Uzbekistan Unemployment Among Women with Children Under 18 years Correlation Chart
The statistical analysis conducted on geographies consisting of 488,214,220 people shows a weak positive correlation between the proportion of Norwegians and unemployment rate among women with children under the age of 18 in the United States with a correlation coefficient (R) of 0.291 and weighted average of 4.4%. Similarly, the statistical analysis conducted on geographies consisting of 117,401,289 people shows no correlation between the proportion of Immigrants from Uzbekistan and unemployment rate among women with children under the age of 18 in the United States with a correlation coefficient (R) of 0.016 and weighted average of 5.4%, a difference of 23.9%.
Unemployment Among Women with Children Under 18 years Correlation Summary
| Measurement | Norwegian | Immigrants from Uzbekistan |
| Minimum | 0.86% | 1.4% |
| Maximum | 20.5% | 15.4% |
| Range | 19.6% | 14.0% |
| Mean | 4.4% | 5.6% |
| Median | 3.6% | 5.0% |
| Interquartile 25% (IQ1) | 2.9% | 3.7% |
| Interquartile 75% (IQ3) | 4.7% | 6.5% |
| Interquartile Range (IQR) | 1.8% | 2.8% |
| Standard Deviation (Sample) | 3.0% | 2.8% |
| Standard Deviation (Population) | 3.0% | 2.8% |
Similar Demographics by Unemployment Among Women with Children Under 18 years
Demographics Similar to Norwegians by Unemployment Among Women with Children Under 18 years
In terms of unemployment among women with children under 18 years, the demographic groups most similar to Norwegians are Hmong (4.5%, a difference of 2.3%), Danish (4.5%, a difference of 3.3%), Swedish (4.7%, a difference of 6.0%), Tongan (4.7%, a difference of 6.1%), and Immigrants from Taiwan (4.7%, a difference of 6.2%).
| Demographics | Rating | Rank | Unemployment Among Women with Children Under 18 years |
| Norwegians | 100.0 /100 | #1 | Exceptional 4.4% |
| Hmong | 100.0 /100 | #2 | Exceptional 4.5% |
| Danes | 100.0 /100 | #3 | Exceptional 4.5% |
| Swedes | 100.0 /100 | #4 | Exceptional 4.7% |
| Tongans | 100.0 /100 | #5 | Exceptional 4.7% |
| Immigrants | Taiwan | 100.0 /100 | #6 | Exceptional 4.7% |
| Immigrants | India | 100.0 /100 | #7 | Exceptional 4.7% |
| Immigrants | Hong Kong | 100.0 /100 | #8 | Exceptional 4.7% |
| Okinawans | 99.9 /100 | #9 | Exceptional 4.7% |
| Czechs | 99.9 /100 | #10 | Exceptional 4.7% |
| Filipinos | 99.9 /100 | #11 | Exceptional 4.8% |
| Scandinavians | 99.9 /100 | #12 | Exceptional 4.8% |
| Bulgarians | 99.9 /100 | #13 | Exceptional 4.8% |
| Cambodians | 99.9 /100 | #14 | Exceptional 4.8% |
| Thais | 99.8 /100 | #15 | Exceptional 4.8% |
Demographics Similar to Immigrants from Uzbekistan by Unemployment Among Women with Children Under 18 years
In terms of unemployment among women with children under 18 years, the demographic groups most similar to Immigrants from Uzbekistan are Spanish (5.4%, a difference of 0.070%), Immigrants from Eastern Africa (5.4%, a difference of 0.090%), Immigrants from Germany (5.5%, a difference of 0.11%), Immigrants from Kazakhstan (5.4%, a difference of 0.12%), and Immigrants from Philippines (5.4%, a difference of 0.22%).
| Demographics | Rating | Rank | Unemployment Among Women with Children Under 18 years |
| Immigrants | Denmark | 58.0 /100 | #167 | Average 5.4% |
| Immigrants | Northern Africa | 56.1 /100 | #168 | Average 5.4% |
| Immigrants | Thailand | 55.3 /100 | #169 | Average 5.4% |
| Samoans | 54.1 /100 | #170 | Average 5.4% |
| Immigrants | Philippines | 53.1 /100 | #171 | Average 5.4% |
| Immigrants | Kazakhstan | 51.7 /100 | #172 | Average 5.4% |
| Immigrants | Eastern Africa | 51.3 /100 | #173 | Average 5.4% |
| Immigrants | Uzbekistan | 50.0 /100 | #174 | Average 5.4% |
| Spanish | 49.0 /100 | #175 | Average 5.4% |
| Immigrants | Germany | 48.5 /100 | #176 | Average 5.5% |
| Hawaiians | 46.1 /100 | #177 | Average 5.5% |
| Costa Ricans | 45.2 /100 | #178 | Average 5.5% |
| Syrians | 42.8 /100 | #179 | Average 5.5% |
| Immigrants | Southern Europe | 42.7 /100 | #180 | Average 5.5% |
| Immigrants | Hungary | 41.3 /100 | #181 | Average 5.5% |