Norwegian vs Ukrainian Unemployment Among Women with Children Under 18 years
COMPARE
Norwegian
Ukrainian
Unemployment Among Women with Children Under 18 years
Unemployment Among Women with Children Under 18 years Comparison
Norwegians
Ukrainians
4.4%
UNEMPLOYMENT AMONG WOMEN WITH CHILDREN UNDER 18 YEARS
100.0/ 100
METRIC RATING
1st/ 347
METRIC RANK
5.2%
UNEMPLOYMENT AMONG WOMEN WITH CHILDREN UNDER 18 YEARS
93.8/ 100
METRIC RATING
90th/ 347
METRIC RANK
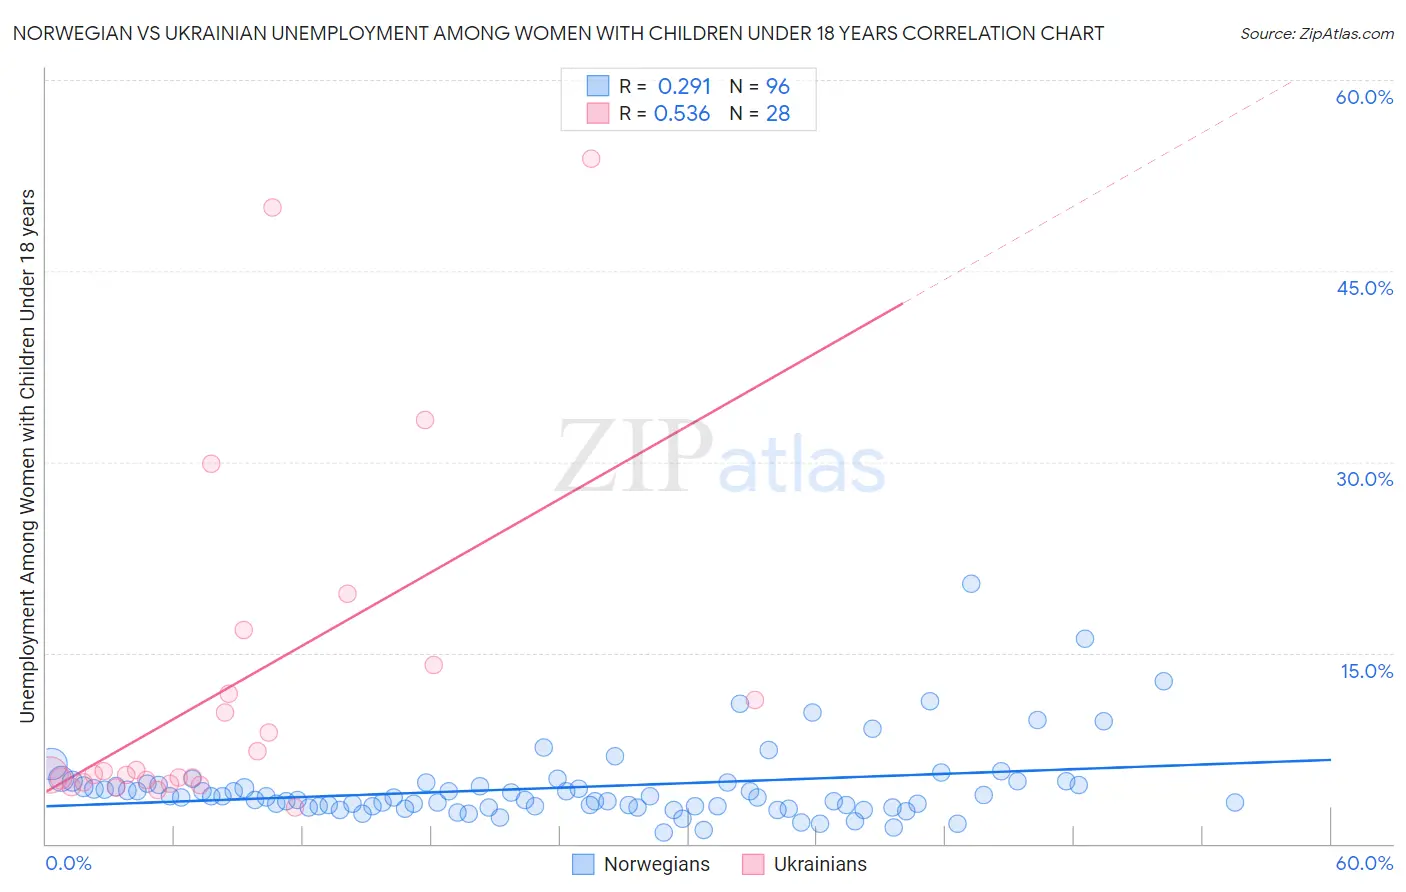
Norwegian vs Ukrainian Unemployment Among Women with Children Under 18 years Correlation Chart
The statistical analysis conducted on geographies consisting of 488,214,220 people shows a weak positive correlation between the proportion of Norwegians and unemployment rate among women with children under the age of 18 in the United States with a correlation coefficient (R) of 0.291 and weighted average of 4.4%. Similarly, the statistical analysis conducted on geographies consisting of 422,457,638 people shows a substantial positive correlation between the proportion of Ukrainians and unemployment rate among women with children under the age of 18 in the United States with a correlation coefficient (R) of 0.536 and weighted average of 5.2%, a difference of 17.9%.
Unemployment Among Women with Children Under 18 years Correlation Summary
| Measurement | Norwegian | Ukrainian |
| Minimum | 0.86% | 2.8% |
| Maximum | 20.5% | 53.8% |
| Range | 19.6% | 51.0% |
| Mean | 4.4% | 12.3% |
| Median | 3.6% | 5.6% |
| Interquartile 25% (IQ1) | 2.9% | 5.0% |
| Interquartile 75% (IQ3) | 4.7% | 12.9% |
| Interquartile Range (IQR) | 1.8% | 7.9% |
| Standard Deviation (Sample) | 3.0% | 13.5% |
| Standard Deviation (Population) | 3.0% | 13.2% |
Similar Demographics by Unemployment Among Women with Children Under 18 years
Demographics Similar to Norwegians by Unemployment Among Women with Children Under 18 years
In terms of unemployment among women with children under 18 years, the demographic groups most similar to Norwegians are Hmong (4.5%, a difference of 2.3%), Danish (4.5%, a difference of 3.3%), Swedish (4.7%, a difference of 6.0%), Tongan (4.7%, a difference of 6.1%), and Immigrants from Taiwan (4.7%, a difference of 6.2%).
| Demographics | Rating | Rank | Unemployment Among Women with Children Under 18 years |
| Norwegians | 100.0 /100 | #1 | Exceptional 4.4% |
| Hmong | 100.0 /100 | #2 | Exceptional 4.5% |
| Danes | 100.0 /100 | #3 | Exceptional 4.5% |
| Swedes | 100.0 /100 | #4 | Exceptional 4.7% |
| Tongans | 100.0 /100 | #5 | Exceptional 4.7% |
| Immigrants | Taiwan | 100.0 /100 | #6 | Exceptional 4.7% |
| Immigrants | India | 100.0 /100 | #7 | Exceptional 4.7% |
| Immigrants | Hong Kong | 100.0 /100 | #8 | Exceptional 4.7% |
| Okinawans | 99.9 /100 | #9 | Exceptional 4.7% |
| Czechs | 99.9 /100 | #10 | Exceptional 4.7% |
| Filipinos | 99.9 /100 | #11 | Exceptional 4.8% |
| Scandinavians | 99.9 /100 | #12 | Exceptional 4.8% |
| Bulgarians | 99.9 /100 | #13 | Exceptional 4.8% |
| Cambodians | 99.9 /100 | #14 | Exceptional 4.8% |
| Thais | 99.8 /100 | #15 | Exceptional 4.8% |
Demographics Similar to Ukrainians by Unemployment Among Women with Children Under 18 years
In terms of unemployment among women with children under 18 years, the demographic groups most similar to Ukrainians are Immigrants from Zimbabwe (5.2%, a difference of 0.070%), Immigrants from Turkey (5.2%, a difference of 0.13%), Immigrants from Pakistan (5.2%, a difference of 0.16%), Immigrants from Canada (5.2%, a difference of 0.17%), and Immigrants from Scotland (5.2%, a difference of 0.23%).
| Demographics | Rating | Rank | Unemployment Among Women with Children Under 18 years |
| Maltese | 95.1 /100 | #83 | Exceptional 5.2% |
| Australians | 95.1 /100 | #84 | Exceptional 5.2% |
| Paraguayans | 94.8 /100 | #85 | Exceptional 5.2% |
| Immigrants | Indonesia | 94.8 /100 | #86 | Exceptional 5.2% |
| Laotians | 94.7 /100 | #87 | Exceptional 5.2% |
| Immigrants | Scotland | 94.5 /100 | #88 | Exceptional 5.2% |
| Immigrants | Turkey | 94.2 /100 | #89 | Exceptional 5.2% |
| Ukrainians | 93.8 /100 | #90 | Exceptional 5.2% |
| Immigrants | Zimbabwe | 93.6 /100 | #91 | Exceptional 5.2% |
| Immigrants | Pakistan | 93.3 /100 | #92 | Exceptional 5.2% |
| Immigrants | Canada | 93.3 /100 | #93 | Exceptional 5.2% |
| Immigrants | Kuwait | 92.6 /100 | #94 | Exceptional 5.2% |
| Immigrants | North America | 92.3 /100 | #95 | Exceptional 5.2% |
| Immigrants | Albania | 92.2 /100 | #96 | Exceptional 5.2% |
| Palestinians | 92.2 /100 | #97 | Exceptional 5.2% |