Sudanese vs Immigrants from Uzbekistan Unemployment Among Women with Children Under 18 years
COMPARE
Sudanese
Immigrants from Uzbekistan
Unemployment Among Women with Children Under 18 years
Unemployment Among Women with Children Under 18 years Comparison
Sudanese
Immigrants from Uzbekistan
5.3%
UNEMPLOYMENT AMONG WOMEN WITH CHILDREN UNDER 18 YEARS
84.3/ 100
METRIC RATING
123rd/ 347
METRIC RANK
5.4%
UNEMPLOYMENT AMONG WOMEN WITH CHILDREN UNDER 18 YEARS
50.0/ 100
METRIC RATING
174th/ 347
METRIC RANK
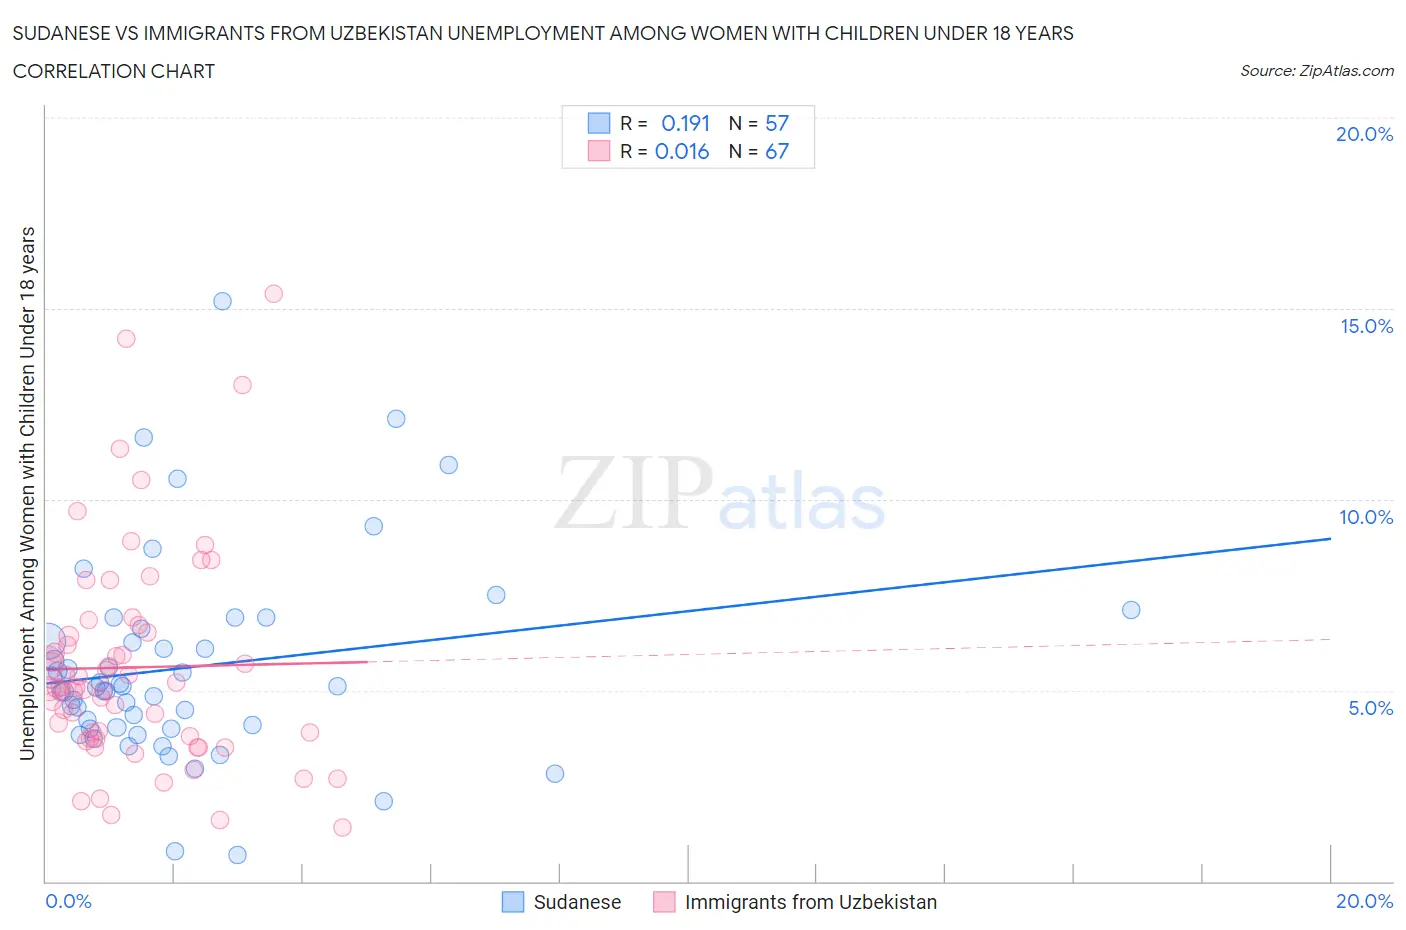
Sudanese vs Immigrants from Uzbekistan Unemployment Among Women with Children Under 18 years Correlation Chart
The statistical analysis conducted on geographies consisting of 109,134,531 people shows a poor positive correlation between the proportion of Sudanese and unemployment rate among women with children under the age of 18 in the United States with a correlation coefficient (R) of 0.191 and weighted average of 5.3%. Similarly, the statistical analysis conducted on geographies consisting of 117,401,289 people shows no correlation between the proportion of Immigrants from Uzbekistan and unemployment rate among women with children under the age of 18 in the United States with a correlation coefficient (R) of 0.016 and weighted average of 5.4%, a difference of 3.1%.
Unemployment Among Women with Children Under 18 years Correlation Summary
| Measurement | Sudanese | Immigrants from Uzbekistan |
| Minimum | 0.70% | 1.4% |
| Maximum | 15.2% | 15.4% |
| Range | 14.5% | 14.0% |
| Mean | 5.6% | 5.6% |
| Median | 5.1% | 5.0% |
| Interquartile 25% (IQ1) | 4.0% | 3.7% |
| Interquartile 75% (IQ3) | 6.5% | 6.5% |
| Interquartile Range (IQR) | 2.4% | 2.8% |
| Standard Deviation (Sample) | 2.6% | 2.8% |
| Standard Deviation (Population) | 2.6% | 2.8% |
Similar Demographics by Unemployment Among Women with Children Under 18 years
Demographics Similar to Sudanese by Unemployment Among Women with Children Under 18 years
In terms of unemployment among women with children under 18 years, the demographic groups most similar to Sudanese are Native Hawaiian (5.3%, a difference of 0.050%), Immigrants from North Macedonia (5.3%, a difference of 0.16%), Immigrants from Oceania (5.3%, a difference of 0.17%), Scotch-Irish (5.3%, a difference of 0.20%), and White/Caucasian (5.3%, a difference of 0.20%).
| Demographics | Rating | Rank | Unemployment Among Women with Children Under 18 years |
| Macedonians | 87.7 /100 | #116 | Excellent 5.3% |
| Canadians | 87.4 /100 | #117 | Excellent 5.3% |
| Immigrants | Europe | 86.7 /100 | #118 | Excellent 5.3% |
| Basques | 86.5 /100 | #119 | Excellent 5.3% |
| Egyptians | 86.4 /100 | #120 | Excellent 5.3% |
| Immigrants | Romania | 85.8 /100 | #121 | Excellent 5.3% |
| Scotch-Irish | 85.7 /100 | #122 | Excellent 5.3% |
| Sudanese | 84.3 /100 | #123 | Excellent 5.3% |
| Native Hawaiians | 84.0 /100 | #124 | Excellent 5.3% |
| Immigrants | North Macedonia | 83.2 /100 | #125 | Excellent 5.3% |
| Immigrants | Oceania | 83.1 /100 | #126 | Excellent 5.3% |
| Whites/Caucasians | 82.9 /100 | #127 | Excellent 5.3% |
| Immigrants | South Africa | 82.8 /100 | #128 | Excellent 5.3% |
| Immigrants | Italy | 82.3 /100 | #129 | Excellent 5.3% |
| Immigrants | Austria | 82.1 /100 | #130 | Excellent 5.3% |
Demographics Similar to Immigrants from Uzbekistan by Unemployment Among Women with Children Under 18 years
In terms of unemployment among women with children under 18 years, the demographic groups most similar to Immigrants from Uzbekistan are Spanish (5.4%, a difference of 0.070%), Immigrants from Eastern Africa (5.4%, a difference of 0.090%), Immigrants from Germany (5.5%, a difference of 0.11%), Immigrants from Kazakhstan (5.4%, a difference of 0.12%), and Immigrants from Philippines (5.4%, a difference of 0.22%).
| Demographics | Rating | Rank | Unemployment Among Women with Children Under 18 years |
| Immigrants | Denmark | 58.0 /100 | #167 | Average 5.4% |
| Immigrants | Northern Africa | 56.1 /100 | #168 | Average 5.4% |
| Immigrants | Thailand | 55.3 /100 | #169 | Average 5.4% |
| Samoans | 54.1 /100 | #170 | Average 5.4% |
| Immigrants | Philippines | 53.1 /100 | #171 | Average 5.4% |
| Immigrants | Kazakhstan | 51.7 /100 | #172 | Average 5.4% |
| Immigrants | Eastern Africa | 51.3 /100 | #173 | Average 5.4% |
| Immigrants | Uzbekistan | 50.0 /100 | #174 | Average 5.4% |
| Spanish | 49.0 /100 | #175 | Average 5.4% |
| Immigrants | Germany | 48.5 /100 | #176 | Average 5.5% |
| Hawaiians | 46.1 /100 | #177 | Average 5.5% |
| Costa Ricans | 45.2 /100 | #178 | Average 5.5% |
| Syrians | 42.8 /100 | #179 | Average 5.5% |
| Immigrants | Southern Europe | 42.7 /100 | #180 | Average 5.5% |
| Immigrants | Hungary | 41.3 /100 | #181 | Average 5.5% |