Norwegian vs Navajo Unemployment Among Ages 55 to 59 years
COMPARE
Norwegian
Navajo
Unemployment Among Ages 55 to 59 years
Unemployment Among Ages 55 to 59 years Comparison
Norwegians
Navajo
4.2%
UNEMPLOYMENT AMONG AGES 55 TO 59 YEARS
100.0/ 100
METRIC RATING
6th/ 347
METRIC RANK
6.7%
UNEMPLOYMENT AMONG AGES 55 TO 59 YEARS
0.0/ 100
METRIC RATING
336th/ 347
METRIC RANK
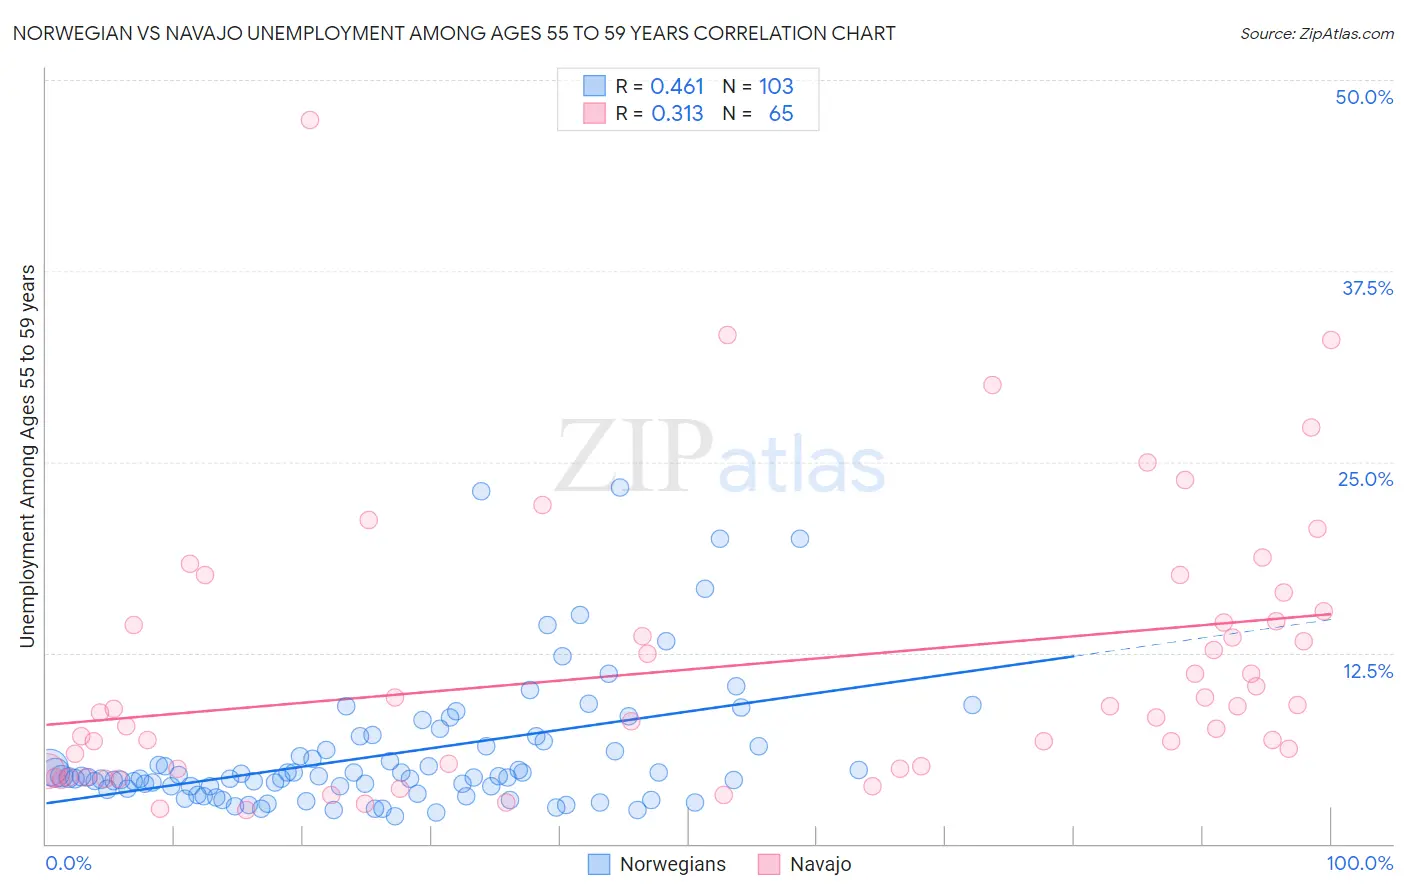
Norwegian vs Navajo Unemployment Among Ages 55 to 59 years Correlation Chart
The statistical analysis conducted on geographies consisting of 463,929,347 people shows a moderate positive correlation between the proportion of Norwegians and unemployment rate among population between the ages 55 and 59 in the United States with a correlation coefficient (R) of 0.461 and weighted average of 4.2%. Similarly, the statistical analysis conducted on geographies consisting of 212,930,605 people shows a mild positive correlation between the proportion of Navajo and unemployment rate among population between the ages 55 and 59 in the United States with a correlation coefficient (R) of 0.313 and weighted average of 6.7%, a difference of 59.8%.
Unemployment Among Ages 55 to 59 years Correlation Summary
| Measurement | Norwegian | Navajo |
| Minimum | 1.8% | 2.2% |
| Maximum | 23.3% | 47.4% |
| Range | 21.5% | 45.2% |
| Mean | 5.8% | 11.6% |
| Median | 4.4% | 8.8% |
| Interquartile 25% (IQ1) | 3.6% | 4.9% |
| Interquartile 75% (IQ3) | 6.4% | 14.9% |
| Interquartile Range (IQR) | 2.7% | 10.0% |
| Standard Deviation (Sample) | 4.3% | 8.9% |
| Standard Deviation (Population) | 4.3% | 8.9% |
Similar Demographics by Unemployment Among Ages 55 to 59 years
Demographics Similar to Norwegians by Unemployment Among Ages 55 to 59 years
In terms of unemployment among ages 55 to 59 years, the demographic groups most similar to Norwegians are Zimbabwean (4.2%, a difference of 0.57%), Immigrants from Bolivia (4.2%, a difference of 0.58%), Bolivian (4.2%, a difference of 0.68%), Cuban (4.2%, a difference of 0.80%), and Venezuelan (4.2%, a difference of 1.1%).
| Demographics | Rating | Rank | Unemployment Among Ages 55 to 59 years |
| Fijians | 100.0 /100 | #1 | Exceptional 4.1% |
| Immigrants | Cuba | 100.0 /100 | #2 | Exceptional 4.1% |
| Immigrants | Venezuela | 100.0 /100 | #3 | Exceptional 4.1% |
| Venezuelans | 100.0 /100 | #4 | Exceptional 4.2% |
| Immigrants | Bolivia | 100.0 /100 | #5 | Exceptional 4.2% |
| Norwegians | 100.0 /100 | #6 | Exceptional 4.2% |
| Zimbabweans | 100.0 /100 | #7 | Exceptional 4.2% |
| Bolivians | 100.0 /100 | #8 | Exceptional 4.2% |
| Cubans | 100.0 /100 | #9 | Exceptional 4.2% |
| Tongans | 100.0 /100 | #10 | Exceptional 4.3% |
| Immigrants | Congo | 100.0 /100 | #11 | Exceptional 4.3% |
| Danes | 100.0 /100 | #12 | Exceptional 4.3% |
| Indonesians | 100.0 /100 | #13 | Exceptional 4.3% |
| Immigrants | India | 100.0 /100 | #14 | Exceptional 4.3% |
| Bulgarians | 100.0 /100 | #15 | Exceptional 4.3% |
Demographics Similar to Navajo by Unemployment Among Ages 55 to 59 years
In terms of unemployment among ages 55 to 59 years, the demographic groups most similar to Navajo are Colville (6.7%, a difference of 0.15%), Pueblo (6.7%, a difference of 0.33%), Paiute (6.8%, a difference of 0.52%), Pima (6.6%, a difference of 1.6%), and Immigrants from Yemen (6.9%, a difference of 2.5%).
| Demographics | Rating | Rank | Unemployment Among Ages 55 to 59 years |
| Dominicans | 0.0 /100 | #329 | Tragic 6.2% |
| Alaska Natives | 0.0 /100 | #330 | Tragic 6.2% |
| Immigrants | Dominican Republic | 0.0 /100 | #331 | Tragic 6.3% |
| Aleuts | 0.0 /100 | #332 | Tragic 6.4% |
| Pima | 0.0 /100 | #333 | Tragic 6.6% |
| Pueblo | 0.0 /100 | #334 | Tragic 6.7% |
| Colville | 0.0 /100 | #335 | Tragic 6.7% |
| Navajo | 0.0 /100 | #336 | Tragic 6.7% |
| Paiute | 0.0 /100 | #337 | Tragic 6.8% |
| Immigrants | Yemen | 0.0 /100 | #338 | Tragic 6.9% |
| Puerto Ricans | 0.0 /100 | #339 | Tragic 7.0% |
| Alaskan Athabascans | 0.0 /100 | #340 | Tragic 7.1% |
| Shoshone | 0.0 /100 | #341 | Tragic 7.4% |
| Hopi | 0.0 /100 | #342 | Tragic 8.1% |
| Yakama | 0.0 /100 | #343 | Tragic 8.9% |