Ethiopian vs Sudanese Unemployment Among Ages 25 to 29 years
COMPARE
Ethiopian
Sudanese
Unemployment Among Ages 25 to 29 years
Unemployment Among Ages 25 to 29 years Comparison
Ethiopians
Sudanese
6.1%
UNEMPLOYMENT AMONG AGES 25 TO 29 YEARS
99.4/ 100
METRIC RATING
38th/ 347
METRIC RANK
5.4%
UNEMPLOYMENT AMONG AGES 25 TO 29 YEARS
100.0/ 100
METRIC RATING
1st/ 347
METRIC RANK
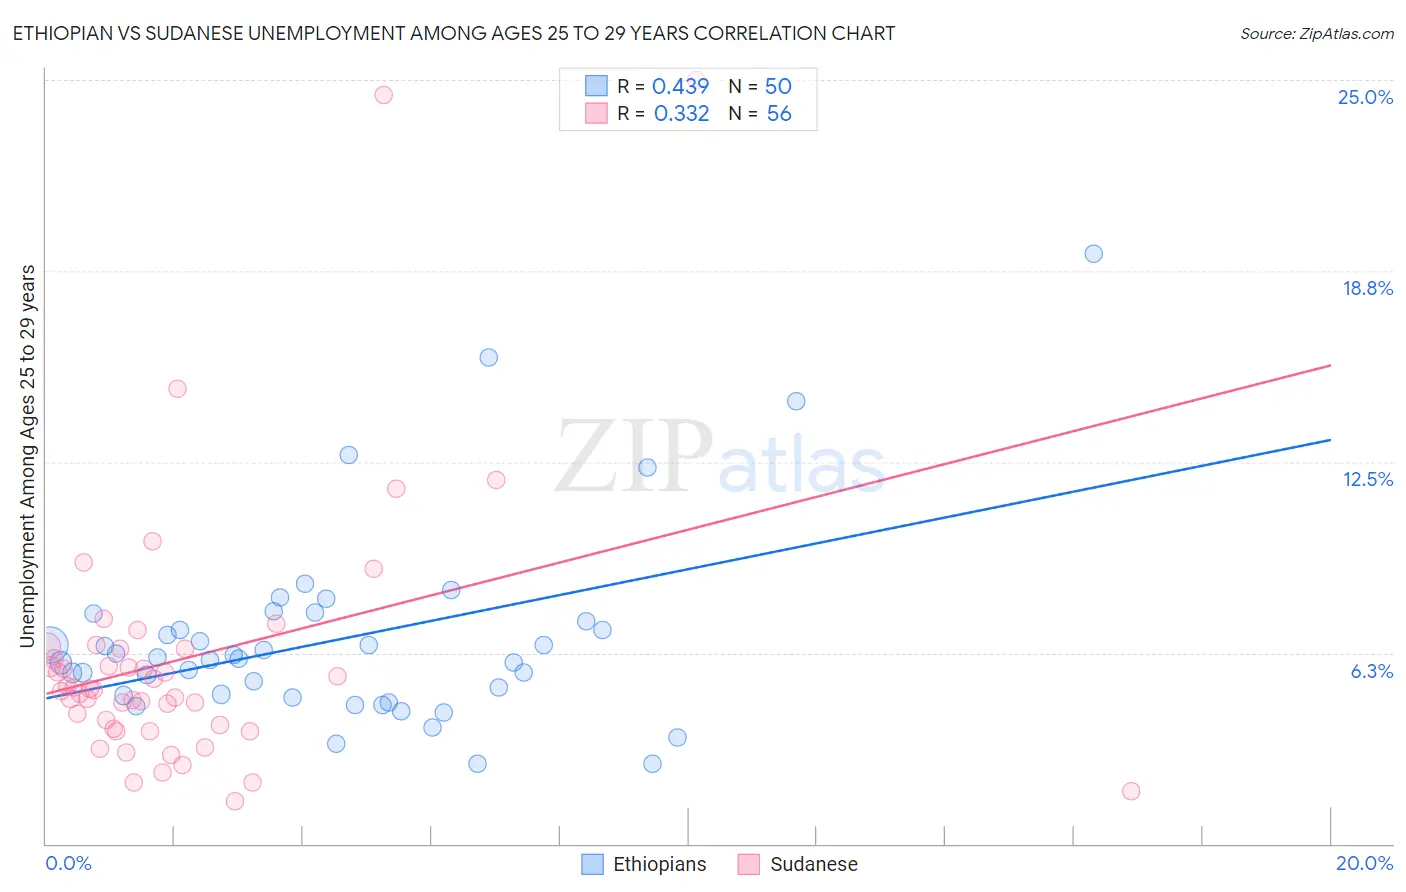
Ethiopian vs Sudanese Unemployment Among Ages 25 to 29 years Correlation Chart
The statistical analysis conducted on geographies consisting of 218,482,739 people shows a moderate positive correlation between the proportion of Ethiopians and unemployment rate among population between the ages 25 and 29 in the United States with a correlation coefficient (R) of 0.439 and weighted average of 6.1%. Similarly, the statistical analysis conducted on geographies consisting of 108,696,537 people shows a mild positive correlation between the proportion of Sudanese and unemployment rate among population between the ages 25 and 29 in the United States with a correlation coefficient (R) of 0.332 and weighted average of 5.4%, a difference of 13.8%.
Unemployment Among Ages 25 to 29 years Correlation Summary
| Measurement | Ethiopian | Sudanese |
| Minimum | 2.6% | 1.4% |
| Maximum | 19.3% | 25.0% |
| Range | 16.7% | 23.6% |
| Mean | 6.7% | 6.1% |
| Median | 6.1% | 5.0% |
| Interquartile 25% (IQ1) | 4.9% | 3.8% |
| Interquartile 75% (IQ3) | 7.3% | 6.4% |
| Interquartile Range (IQR) | 2.4% | 2.6% |
| Standard Deviation (Sample) | 3.2% | 4.4% |
| Standard Deviation (Population) | 3.2% | 4.4% |
Similar Demographics by Unemployment Among Ages 25 to 29 years
Demographics Similar to Ethiopians by Unemployment Among Ages 25 to 29 years
In terms of unemployment among ages 25 to 29 years, the demographic groups most similar to Ethiopians are Immigrants from Serbia (6.1%, a difference of 0.14%), Taiwanese (6.1%, a difference of 0.19%), Indonesian (6.1%, a difference of 0.20%), Immigrants from Zimbabwe (6.1%, a difference of 0.21%), and Immigrants from Morocco (6.1%, a difference of 0.25%).
| Demographics | Rating | Rank | Unemployment Among Ages 25 to 29 years |
| Filipinos | 99.7 /100 | #31 | Exceptional 6.1% |
| Chinese | 99.6 /100 | #32 | Exceptional 6.1% |
| Yugoslavians | 99.6 /100 | #33 | Exceptional 6.1% |
| Immigrants | Morocco | 99.5 /100 | #34 | Exceptional 6.1% |
| Immigrants | Zimbabwe | 99.5 /100 | #35 | Exceptional 6.1% |
| Taiwanese | 99.5 /100 | #36 | Exceptional 6.1% |
| Immigrants | Serbia | 99.5 /100 | #37 | Exceptional 6.1% |
| Ethiopians | 99.4 /100 | #38 | Exceptional 6.1% |
| Indonesians | 99.3 /100 | #39 | Exceptional 6.1% |
| Immigrants | Kenya | 99.3 /100 | #40 | Exceptional 6.1% |
| Fijians | 99.3 /100 | #41 | Exceptional 6.1% |
| Jordanians | 99.3 /100 | #42 | Exceptional 6.1% |
| Czechs | 99.2 /100 | #43 | Exceptional 6.2% |
| Mongolians | 99.2 /100 | #44 | Exceptional 6.2% |
| Venezuelans | 99.1 /100 | #45 | Exceptional 6.2% |
Demographics Similar to Sudanese by Unemployment Among Ages 25 to 29 years
In terms of unemployment among ages 25 to 29 years, the demographic groups most similar to Sudanese are Tongan (5.5%, a difference of 2.5%), Immigrants from Somalia (5.5%, a difference of 2.8%), Immigrants from Cuba (5.6%, a difference of 4.9%), Somali (5.6%, a difference of 5.0%), and Hmong (5.7%, a difference of 5.2%).
| Demographics | Rating | Rank | Unemployment Among Ages 25 to 29 years |
| Sudanese | 100.0 /100 | #1 | Exceptional 5.4% |
| Tongans | 100.0 /100 | #2 | Exceptional 5.5% |
| Immigrants | Somalia | 100.0 /100 | #3 | Exceptional 5.5% |
| Immigrants | Cuba | 100.0 /100 | #4 | Exceptional 5.6% |
| Somalis | 100.0 /100 | #5 | Exceptional 5.6% |
| Hmong | 100.0 /100 | #6 | Exceptional 5.7% |
| Immigrants | India | 100.0 /100 | #7 | Exceptional 5.7% |
| Immigrants | Bosnia and Herzegovina | 100.0 /100 | #8 | Exceptional 5.7% |
| Immigrants | Nepal | 100.0 /100 | #9 | Exceptional 5.7% |
| Immigrants | Sudan | 100.0 /100 | #10 | Exceptional 5.8% |
| Cambodians | 100.0 /100 | #11 | Exceptional 5.8% |
| Okinawans | 100.0 /100 | #12 | Exceptional 5.9% |
| Immigrants | Bolivia | 100.0 /100 | #13 | Exceptional 5.9% |
| Immigrants | Kuwait | 99.9 /100 | #14 | Exceptional 5.9% |
| Cubans | 99.9 /100 | #15 | Exceptional 5.9% |