Nonimmigrants vs Senegalese Male Unemployment
COMPARE
Nonimmigrants
Senegalese
Male Unemployment
Male Unemployment Comparison
Nonimmigrants
Senegalese
5.4%
MALE UNEMPLOYMENT
13.1/ 100
METRIC RATING
202nd/ 347
METRIC RANK
6.4%
MALE UNEMPLOYMENT
0.0/ 100
METRIC RATING
294th/ 347
METRIC RANK
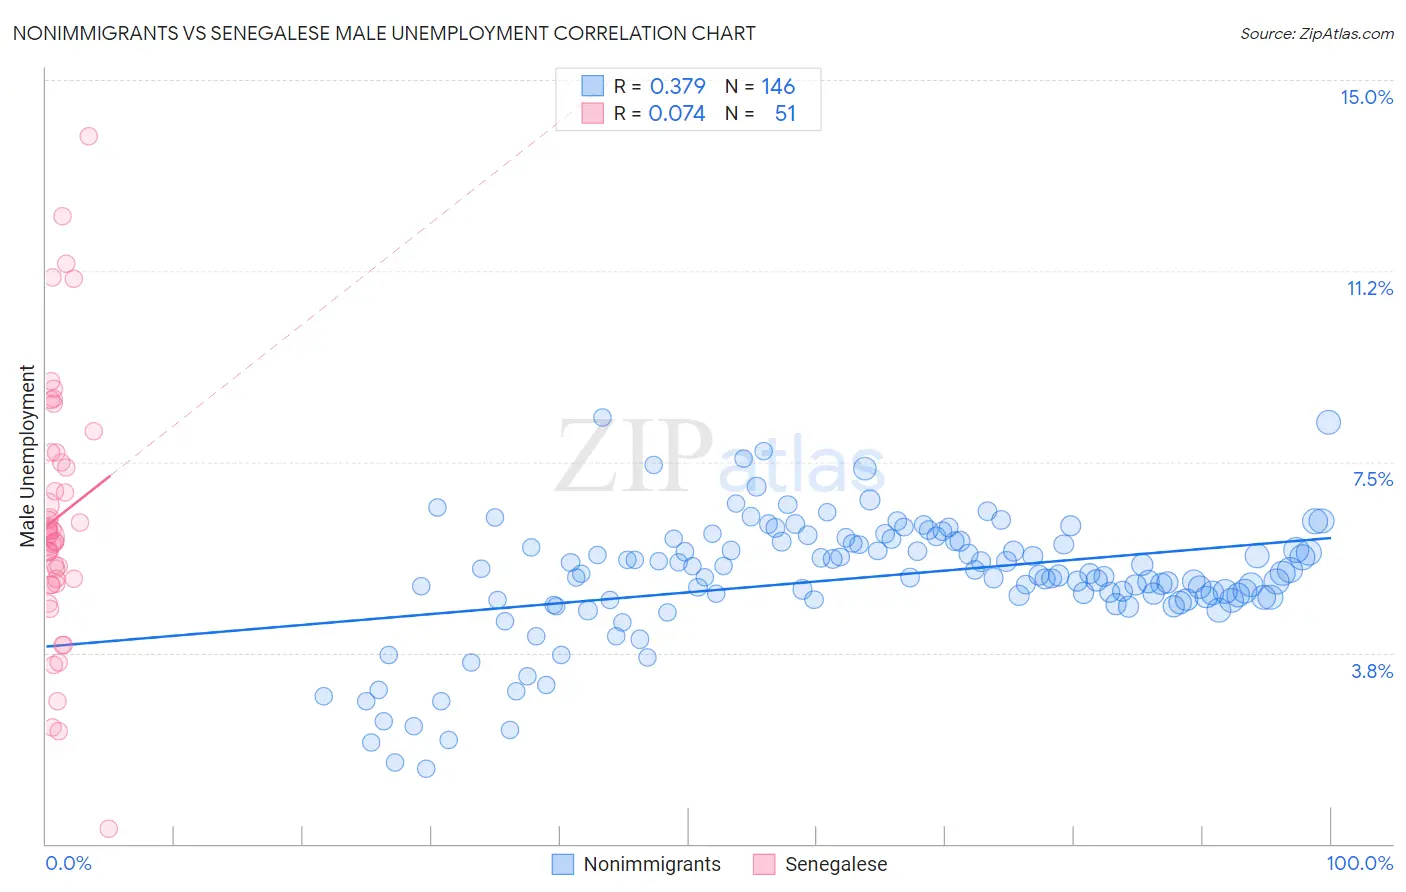
Nonimmigrants vs Senegalese Male Unemployment Correlation Chart
The statistical analysis conducted on geographies consisting of 570,841,743 people shows a mild positive correlation between the proportion of Nonimmigrants and unemployment rate among males in the United States with a correlation coefficient (R) of 0.379 and weighted average of 5.4%. Similarly, the statistical analysis conducted on geographies consisting of 78,095,938 people shows a slight positive correlation between the proportion of Senegalese and unemployment rate among males in the United States with a correlation coefficient (R) of 0.074 and weighted average of 6.4%, a difference of 18.5%.
Male Unemployment Correlation Summary
| Measurement | Nonimmigrants | Senegalese |
| Minimum | 1.5% | 0.30% |
| Maximum | 8.4% | 13.9% |
| Range | 6.9% | 13.6% |
| Mean | 5.2% | 6.4% |
| Median | 5.3% | 6.0% |
| Interquartile 25% (IQ1) | 4.8% | 5.1% |
| Interquartile 75% (IQ3) | 5.9% | 7.7% |
| Interquartile Range (IQR) | 1.1% | 2.6% |
| Standard Deviation (Sample) | 1.2% | 2.6% |
| Standard Deviation (Population) | 1.2% | 2.6% |
Similar Demographics by Male Unemployment
Demographics Similar to Nonimmigrants by Male Unemployment
In terms of male unemployment, the demographic groups most similar to Nonimmigrants are Immigrants from Laos (5.4%, a difference of 0.010%), Immigrants from Philippines (5.4%, a difference of 0.040%), Immigrants from Zaire (5.4%, a difference of 0.070%), Guamanian/Chamorro (5.4%, a difference of 0.10%), and Immigrants from Greece (5.4%, a difference of 0.16%).
| Demographics | Rating | Rank | Male Unemployment |
| Immigrants | Southern Europe | 17.7 /100 | #195 | Poor 5.4% |
| Albanians | 17.3 /100 | #196 | Poor 5.4% |
| Alsatians | 16.7 /100 | #197 | Poor 5.4% |
| Immigrants | Thailand | 14.7 /100 | #198 | Poor 5.4% |
| Immigrants | Greece | 14.5 /100 | #199 | Poor 5.4% |
| Immigrants | Zaire | 13.7 /100 | #200 | Poor 5.4% |
| Immigrants | Philippines | 13.5 /100 | #201 | Poor 5.4% |
| Immigrants | Nonimmigrants | 13.1 /100 | #202 | Poor 5.4% |
| Immigrants | Laos | 13.0 /100 | #203 | Poor 5.4% |
| Guamanians/Chamorros | 12.3 /100 | #204 | Poor 5.4% |
| Immigrants | Costa Rica | 11.4 /100 | #205 | Poor 5.5% |
| Immigrants | Ukraine | 9.9 /100 | #206 | Tragic 5.5% |
| Immigrants | Syria | 9.3 /100 | #207 | Tragic 5.5% |
| Immigrants | Lebanon | 8.6 /100 | #208 | Tragic 5.5% |
| Immigrants | Middle Africa | 8.3 /100 | #209 | Tragic 5.5% |
Demographics Similar to Senegalese by Male Unemployment
In terms of male unemployment, the demographic groups most similar to Senegalese are Haitian (6.4%, a difference of 0.11%), Nepalese (6.4%, a difference of 0.14%), Immigrants from the Azores (6.4%, a difference of 0.48%), Belizean (6.5%, a difference of 0.85%), and U.S. Virgin Islander (6.4%, a difference of 1.0%).
| Demographics | Rating | Rank | Male Unemployment |
| Central American Indians | 0.0 /100 | #287 | Tragic 6.3% |
| Immigrants | Senegal | 0.0 /100 | #288 | Tragic 6.3% |
| Immigrants | Caribbean | 0.0 /100 | #289 | Tragic 6.3% |
| U.S. Virgin Islanders | 0.0 /100 | #290 | Tragic 6.4% |
| Immigrants | Azores | 0.0 /100 | #291 | Tragic 6.4% |
| Nepalese | 0.0 /100 | #292 | Tragic 6.4% |
| Haitians | 0.0 /100 | #293 | Tragic 6.4% |
| Senegalese | 0.0 /100 | #294 | Tragic 6.4% |
| Belizeans | 0.0 /100 | #295 | Tragic 6.5% |
| Immigrants | Haiti | 0.0 /100 | #296 | Tragic 6.5% |
| Chippewa | 0.0 /100 | #297 | Tragic 6.6% |
| Jamaicans | 0.0 /100 | #298 | Tragic 6.6% |
| Immigrants | Bangladesh | 0.0 /100 | #299 | Tragic 6.6% |
| Vietnamese | 0.0 /100 | #300 | Tragic 6.6% |
| Immigrants | Belize | 0.0 /100 | #301 | Tragic 6.6% |