Immigrants from Uganda vs Senegalese Male Unemployment
COMPARE
Immigrants from Uganda
Senegalese
Male Unemployment
Male Unemployment Comparison
Immigrants from Uganda
Senegalese
5.4%
MALE UNEMPLOYMENT
28.8/ 100
METRIC RATING
190th/ 347
METRIC RANK
6.4%
MALE UNEMPLOYMENT
0.0/ 100
METRIC RATING
294th/ 347
METRIC RANK
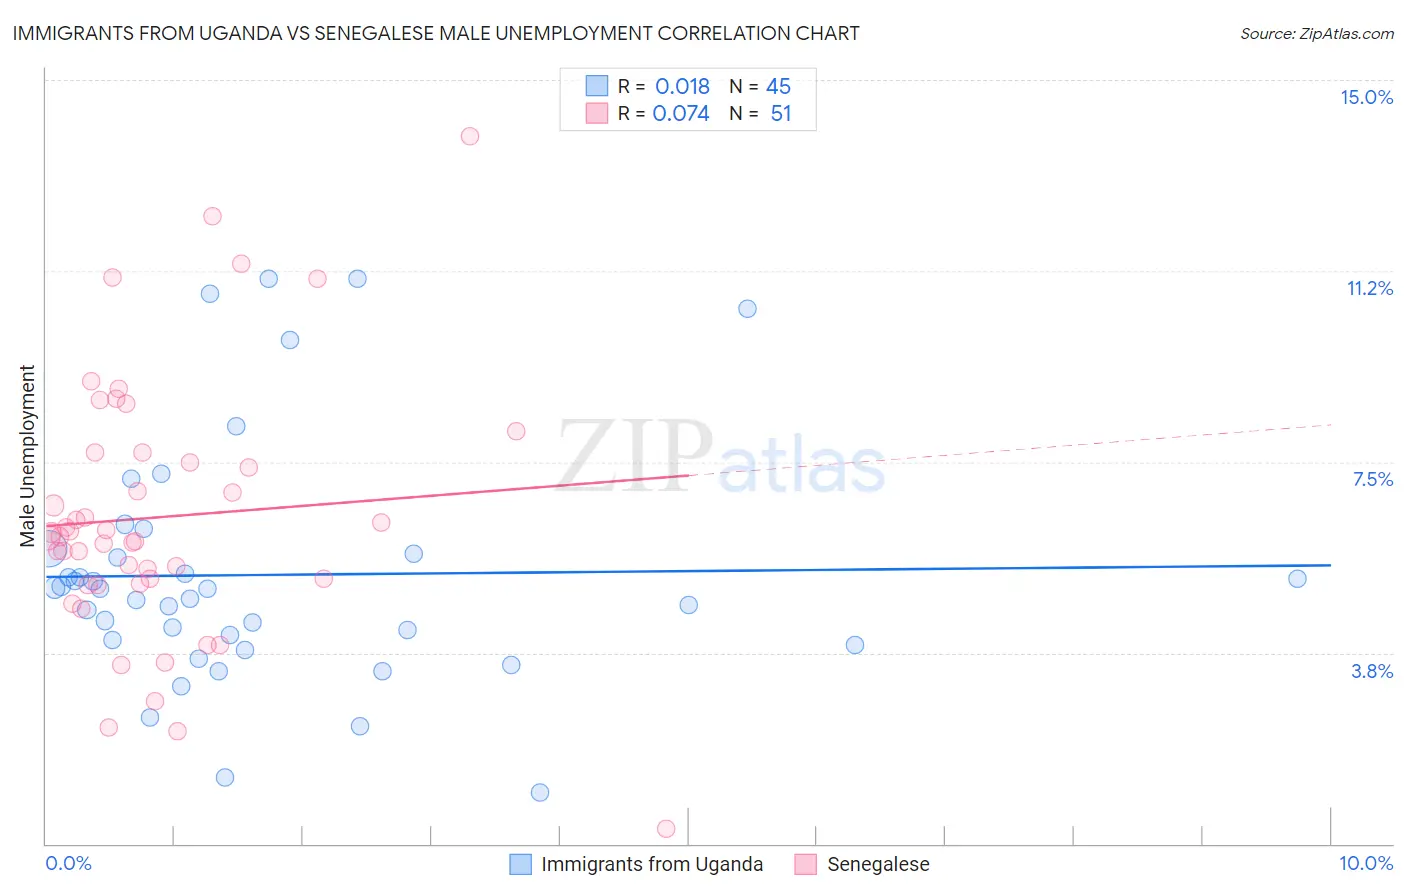
Immigrants from Uganda vs Senegalese Male Unemployment Correlation Chart
The statistical analysis conducted on geographies consisting of 125,897,340 people shows no correlation between the proportion of Immigrants from Uganda and unemployment rate among males in the United States with a correlation coefficient (R) of 0.018 and weighted average of 5.4%. Similarly, the statistical analysis conducted on geographies consisting of 78,095,938 people shows a slight positive correlation between the proportion of Senegalese and unemployment rate among males in the United States with a correlation coefficient (R) of 0.074 and weighted average of 6.4%, a difference of 20.2%.
Male Unemployment Correlation Summary
| Measurement | Immigrants from Uganda | Senegalese |
| Minimum | 1.0% | 0.30% |
| Maximum | 11.1% | 13.9% |
| Range | 10.1% | 13.6% |
| Mean | 5.3% | 6.4% |
| Median | 5.0% | 6.0% |
| Interquartile 25% (IQ1) | 4.0% | 5.1% |
| Interquartile 75% (IQ3) | 5.7% | 7.7% |
| Interquartile Range (IQR) | 1.8% | 2.6% |
| Standard Deviation (Sample) | 2.4% | 2.6% |
| Standard Deviation (Population) | 2.3% | 2.6% |
Similar Demographics by Male Unemployment
Demographics Similar to Immigrants from Uganda by Male Unemployment
In terms of male unemployment, the demographic groups most similar to Immigrants from Uganda are Immigrants from South America (5.4%, a difference of 0.040%), Immigrants from South Eastern Asia (5.4%, a difference of 0.040%), Arab (5.4%, a difference of 0.10%), Costa Rican (5.4%, a difference of 0.18%), and Iraqi (5.4%, a difference of 0.19%).
| Demographics | Rating | Rank | Male Unemployment |
| Taiwanese | 37.6 /100 | #183 | Fair 5.3% |
| Spaniards | 35.1 /100 | #184 | Fair 5.3% |
| Koreans | 34.9 /100 | #185 | Fair 5.3% |
| Iraqis | 31.6 /100 | #186 | Fair 5.4% |
| Costa Ricans | 31.3 /100 | #187 | Fair 5.4% |
| Arabs | 30.2 /100 | #188 | Fair 5.4% |
| Immigrants | South America | 29.4 /100 | #189 | Fair 5.4% |
| Immigrants | Uganda | 28.8 /100 | #190 | Fair 5.4% |
| Immigrants | South Eastern Asia | 28.2 /100 | #191 | Fair 5.4% |
| Immigrants | Belarus | 26.0 /100 | #192 | Fair 5.4% |
| Immigrants | Israel | 25.2 /100 | #193 | Fair 5.4% |
| Spanish | 19.7 /100 | #194 | Poor 5.4% |
| Immigrants | Southern Europe | 17.7 /100 | #195 | Poor 5.4% |
| Albanians | 17.3 /100 | #196 | Poor 5.4% |
| Alsatians | 16.7 /100 | #197 | Poor 5.4% |
Demographics Similar to Senegalese by Male Unemployment
In terms of male unemployment, the demographic groups most similar to Senegalese are Haitian (6.4%, a difference of 0.11%), Nepalese (6.4%, a difference of 0.14%), Immigrants from the Azores (6.4%, a difference of 0.48%), Belizean (6.5%, a difference of 0.85%), and U.S. Virgin Islander (6.4%, a difference of 1.0%).
| Demographics | Rating | Rank | Male Unemployment |
| Central American Indians | 0.0 /100 | #287 | Tragic 6.3% |
| Immigrants | Senegal | 0.0 /100 | #288 | Tragic 6.3% |
| Immigrants | Caribbean | 0.0 /100 | #289 | Tragic 6.3% |
| U.S. Virgin Islanders | 0.0 /100 | #290 | Tragic 6.4% |
| Immigrants | Azores | 0.0 /100 | #291 | Tragic 6.4% |
| Nepalese | 0.0 /100 | #292 | Tragic 6.4% |
| Haitians | 0.0 /100 | #293 | Tragic 6.4% |
| Senegalese | 0.0 /100 | #294 | Tragic 6.4% |
| Belizeans | 0.0 /100 | #295 | Tragic 6.5% |
| Immigrants | Haiti | 0.0 /100 | #296 | Tragic 6.5% |
| Chippewa | 0.0 /100 | #297 | Tragic 6.6% |
| Jamaicans | 0.0 /100 | #298 | Tragic 6.6% |
| Immigrants | Bangladesh | 0.0 /100 | #299 | Tragic 6.6% |
| Vietnamese | 0.0 /100 | #300 | Tragic 6.6% |
| Immigrants | Belize | 0.0 /100 | #301 | Tragic 6.6% |