Nicaraguan vs Immigrants from Senegal Unemployment Among Ages 30 to 34 years
COMPARE
Nicaraguan
Immigrants from Senegal
Unemployment Among Ages 30 to 34 years
Unemployment Among Ages 30 to 34 years Comparison
Nicaraguans
Immigrants from Senegal
5.6%
UNEMPLOYMENT AMONG AGES 30 TO 34 YEARS
26.6/ 100
METRIC RATING
199th/ 347
METRIC RANK
6.3%
UNEMPLOYMENT AMONG AGES 30 TO 34 YEARS
0.0/ 100
METRIC RATING
270th/ 347
METRIC RANK
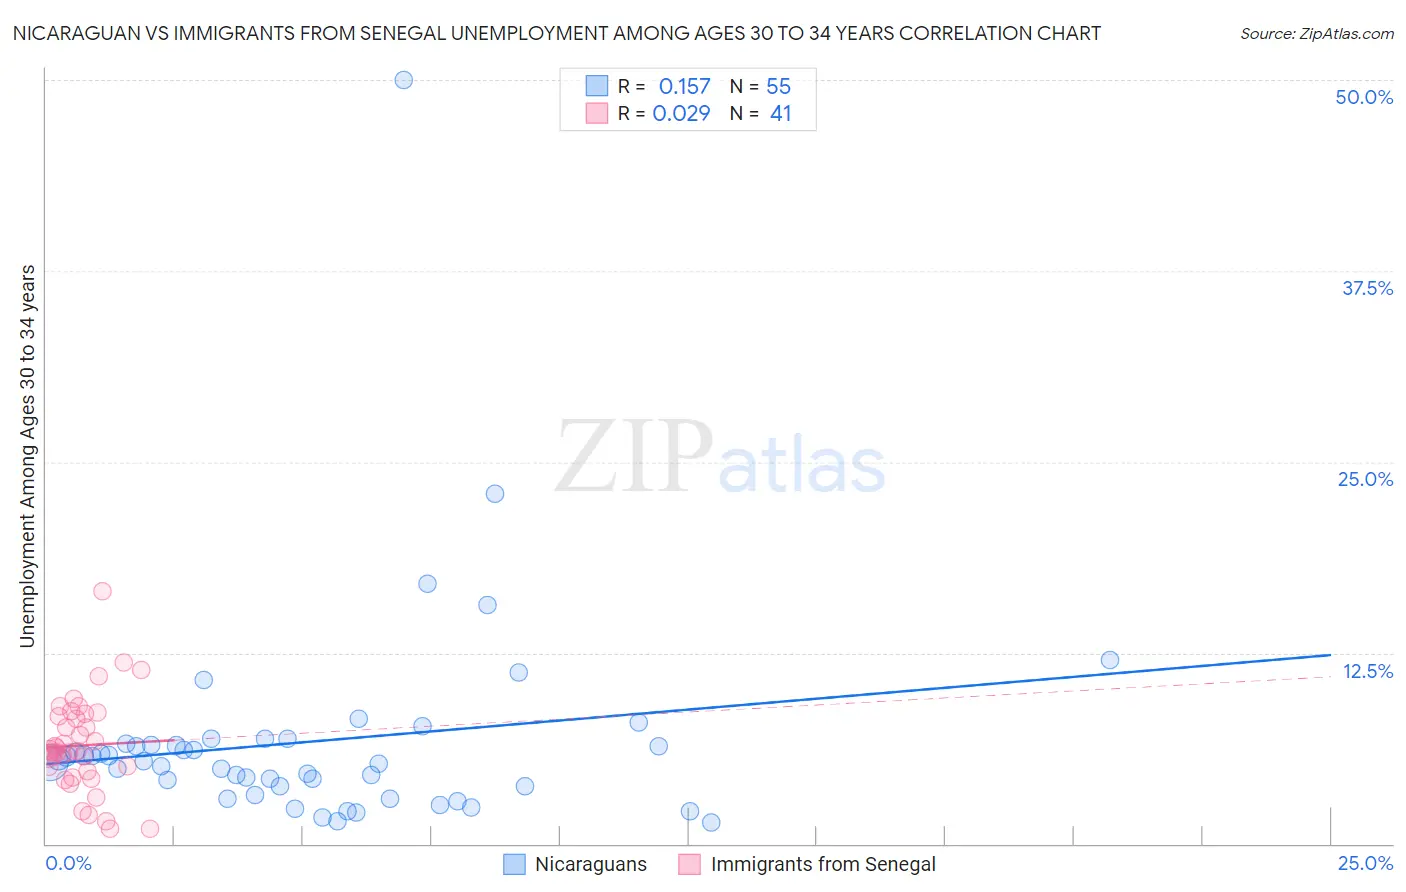
Nicaraguan vs Immigrants from Senegal Unemployment Among Ages 30 to 34 years Correlation Chart
The statistical analysis conducted on geographies consisting of 277,083,341 people shows a poor positive correlation between the proportion of Nicaraguans and unemployment rate among population between the ages 30 and 34 in the United States with a correlation coefficient (R) of 0.157 and weighted average of 5.6%. Similarly, the statistical analysis conducted on geographies consisting of 89,001,618 people shows no correlation between the proportion of Immigrants from Senegal and unemployment rate among population between the ages 30 and 34 in the United States with a correlation coefficient (R) of 0.029 and weighted average of 6.3%, a difference of 12.6%.
Unemployment Among Ages 30 to 34 years Correlation Summary
| Measurement | Nicaraguan | Immigrants from Senegal |
| Minimum | 1.4% | 1.0% |
| Maximum | 50.0% | 16.5% |
| Range | 48.6% | 15.5% |
| Mean | 6.7% | 6.4% |
| Median | 5.4% | 6.0% |
| Interquartile 25% (IQ1) | 3.8% | 4.5% |
| Interquartile 75% (IQ3) | 6.6% | 8.5% |
| Interquartile Range (IQR) | 2.8% | 3.9% |
| Standard Deviation (Sample) | 7.1% | 3.1% |
| Standard Deviation (Population) | 7.0% | 3.1% |
Similar Demographics by Unemployment Among Ages 30 to 34 years
Demographics Similar to Nicaraguans by Unemployment Among Ages 30 to 34 years
In terms of unemployment among ages 30 to 34 years, the demographic groups most similar to Nicaraguans are Immigrants from Afghanistan (5.6%, a difference of 0.050%), Immigrants from Southern Europe (5.6%, a difference of 0.070%), Immigrants from Nicaragua (5.5%, a difference of 0.19%), South American Indian (5.6%, a difference of 0.20%), and Immigrants from South America (5.5%, a difference of 0.27%).
| Demographics | Rating | Rank | Unemployment Among Ages 30 to 34 years |
| Moroccans | 31.2 /100 | #192 | Fair 5.5% |
| Immigrants | Africa | 31.0 /100 | #193 | Fair 5.5% |
| Slavs | 30.9 /100 | #194 | Fair 5.5% |
| Finns | 30.7 /100 | #195 | Fair 5.5% |
| Immigrants | South America | 29.8 /100 | #196 | Fair 5.5% |
| Immigrants | Nicaragua | 28.9 /100 | #197 | Fair 5.5% |
| Immigrants | Afghanistan | 27.2 /100 | #198 | Fair 5.6% |
| Nicaraguans | 26.6 /100 | #199 | Fair 5.6% |
| Immigrants | Southern Europe | 25.8 /100 | #200 | Fair 5.6% |
| South American Indians | 24.4 /100 | #201 | Fair 5.6% |
| Immigrants | Germany | 22.9 /100 | #202 | Fair 5.6% |
| Koreans | 20.7 /100 | #203 | Fair 5.6% |
| Immigrants | Cameroon | 18.4 /100 | #204 | Poor 5.6% |
| Immigrants | Costa Rica | 14.4 /100 | #205 | Poor 5.6% |
| Alsatians | 14.3 /100 | #206 | Poor 5.6% |
Demographics Similar to Immigrants from Senegal by Unemployment Among Ages 30 to 34 years
In terms of unemployment among ages 30 to 34 years, the demographic groups most similar to Immigrants from Senegal are French American Indian (6.3%, a difference of 0.010%), Comanche (6.3%, a difference of 0.19%), Blackfeet (6.3%, a difference of 0.30%), Immigrants from Haiti (6.2%, a difference of 0.31%), and Ottawa (6.3%, a difference of 0.32%).
| Demographics | Rating | Rank | Unemployment Among Ages 30 to 34 years |
| Spanish Americans | 0.0 /100 | #263 | Tragic 6.2% |
| Chickasaw | 0.0 /100 | #264 | Tragic 6.2% |
| Americans | 0.0 /100 | #265 | Tragic 6.2% |
| Seminole | 0.0 /100 | #266 | Tragic 6.2% |
| Immigrants | Mexico | 0.0 /100 | #267 | Tragic 6.2% |
| Immigrants | Haiti | 0.0 /100 | #268 | Tragic 6.2% |
| French American Indians | 0.0 /100 | #269 | Tragic 6.3% |
| Immigrants | Senegal | 0.0 /100 | #270 | Tragic 6.3% |
| Comanche | 0.0 /100 | #271 | Tragic 6.3% |
| Blackfeet | 0.0 /100 | #272 | Tragic 6.3% |
| Ottawa | 0.0 /100 | #273 | Tragic 6.3% |
| U.S. Virgin Islanders | 0.0 /100 | #274 | Tragic 6.3% |
| Ecuadorians | 0.0 /100 | #275 | Tragic 6.3% |
| Pennsylvania Germans | 0.0 /100 | #276 | Tragic 6.3% |
| Immigrants | Ecuador | 0.0 /100 | #277 | Tragic 6.3% |