Immigrants from West Indies vs Immigrants from Senegal Unemployment Among Ages 30 to 34 years
COMPARE
Immigrants from West Indies
Immigrants from Senegal
Unemployment Among Ages 30 to 34 years
Unemployment Among Ages 30 to 34 years Comparison
Immigrants from West Indies
Immigrants from Senegal
6.4%
UNEMPLOYMENT AMONG AGES 30 TO 34 YEARS
0.0/ 100
METRIC RATING
287th/ 347
METRIC RANK
6.3%
UNEMPLOYMENT AMONG AGES 30 TO 34 YEARS
0.0/ 100
METRIC RATING
270th/ 347
METRIC RANK
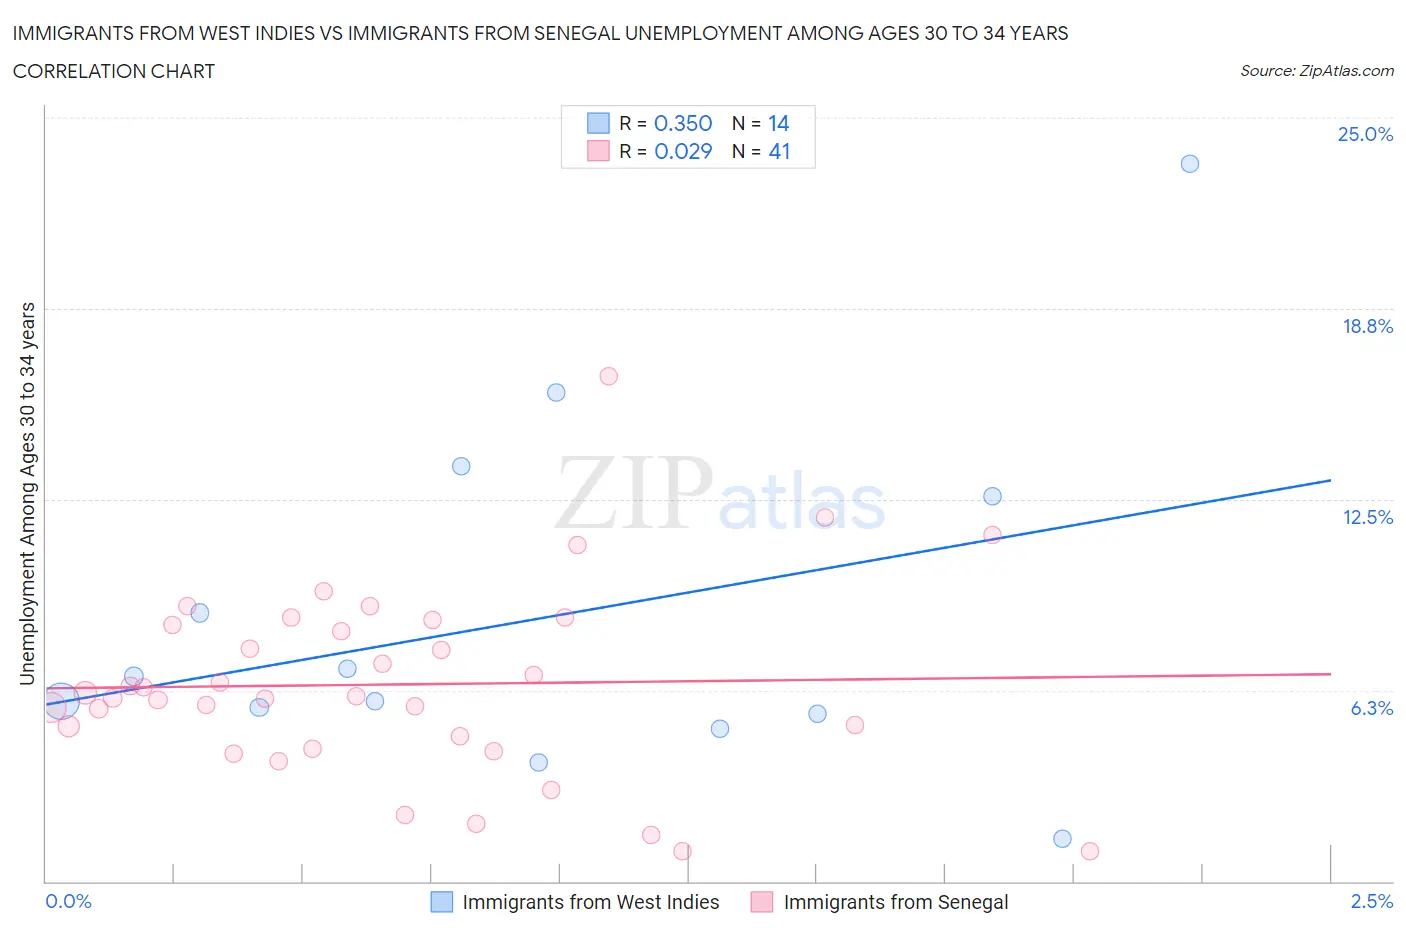
Immigrants from West Indies vs Immigrants from Senegal Unemployment Among Ages 30 to 34 years Correlation Chart
The statistical analysis conducted on geographies consisting of 71,825,237 people shows a mild positive correlation between the proportion of Immigrants from West Indies and unemployment rate among population between the ages 30 and 34 in the United States with a correlation coefficient (R) of 0.350 and weighted average of 6.4%. Similarly, the statistical analysis conducted on geographies consisting of 89,001,618 people shows no correlation between the proportion of Immigrants from Senegal and unemployment rate among population between the ages 30 and 34 in the United States with a correlation coefficient (R) of 0.029 and weighted average of 6.3%, a difference of 2.8%.
Unemployment Among Ages 30 to 34 years Correlation Summary
| Measurement | Immigrants from West Indies | Immigrants from Senegal |
| Minimum | 1.4% | 1.0% |
| Maximum | 23.5% | 16.5% |
| Range | 22.1% | 15.5% |
| Mean | 8.7% | 6.4% |
| Median | 6.3% | 6.0% |
| Interquartile 25% (IQ1) | 5.5% | 4.5% |
| Interquartile 75% (IQ3) | 12.6% | 8.5% |
| Interquartile Range (IQR) | 7.1% | 3.9% |
| Standard Deviation (Sample) | 5.8% | 3.1% |
| Standard Deviation (Population) | 5.6% | 3.1% |
Demographics Similar to Immigrants from West Indies and Immigrants from Senegal by Unemployment Among Ages 30 to 34 years
In terms of unemployment among ages 30 to 34 years, the demographic groups most similar to Immigrants from West Indies are Central American Indian (6.4%, a difference of 0.020%), Senegalese (6.4%, a difference of 0.040%), Choctaw (6.4%, a difference of 0.060%), Immigrants from Bangladesh (6.4%, a difference of 0.17%), and Hispanic or Latino (6.4%, a difference of 0.23%). Similarly, the demographic groups most similar to Immigrants from Senegal are French American Indian (6.3%, a difference of 0.010%), Comanche (6.3%, a difference of 0.19%), Blackfeet (6.3%, a difference of 0.30%), Immigrants from Haiti (6.2%, a difference of 0.31%), and Ottawa (6.3%, a difference of 0.32%).
| Demographics | Rating | Rank | Unemployment Among Ages 30 to 34 years |
| Immigrants | Haiti | 0.0 /100 | #268 | Tragic 6.2% |
| French American Indians | 0.0 /100 | #269 | Tragic 6.3% |
| Immigrants | Senegal | 0.0 /100 | #270 | Tragic 6.3% |
| Comanche | 0.0 /100 | #271 | Tragic 6.3% |
| Blackfeet | 0.0 /100 | #272 | Tragic 6.3% |
| Ottawa | 0.0 /100 | #273 | Tragic 6.3% |
| U.S. Virgin Islanders | 0.0 /100 | #274 | Tragic 6.3% |
| Ecuadorians | 0.0 /100 | #275 | Tragic 6.3% |
| Pennsylvania Germans | 0.0 /100 | #276 | Tragic 6.3% |
| Immigrants | Ecuador | 0.0 /100 | #277 | Tragic 6.3% |
| Osage | 0.0 /100 | #278 | Tragic 6.3% |
| Cree | 0.0 /100 | #279 | Tragic 6.4% |
| Cherokee | 0.0 /100 | #280 | Tragic 6.4% |
| Immigrants | Caribbean | 0.0 /100 | #281 | Tragic 6.4% |
| Africans | 0.0 /100 | #282 | Tragic 6.4% |
| Hispanics or Latinos | 0.0 /100 | #283 | Tragic 6.4% |
| Immigrants | Bangladesh | 0.0 /100 | #284 | Tragic 6.4% |
| Choctaw | 0.0 /100 | #285 | Tragic 6.4% |
| Central American Indians | 0.0 /100 | #286 | Tragic 6.4% |
| Immigrants | West Indies | 0.0 /100 | #287 | Tragic 6.4% |
| Senegalese | 0.0 /100 | #288 | Tragic 6.4% |