Nicaraguan vs Immigrants from Czechoslovakia Unemployment Among Ages 25 to 29 years
COMPARE
Nicaraguan
Immigrants from Czechoslovakia
Unemployment Among Ages 25 to 29 years
Unemployment Among Ages 25 to 29 years Comparison
Nicaraguans
Immigrants from Czechoslovakia
6.6%
UNEMPLOYMENT AMONG AGES 25 TO 29 YEARS
70.2/ 100
METRIC RATING
145th/ 347
METRIC RANK
6.6%
UNEMPLOYMENT AMONG AGES 25 TO 29 YEARS
60.2/ 100
METRIC RATING
162nd/ 347
METRIC RANK
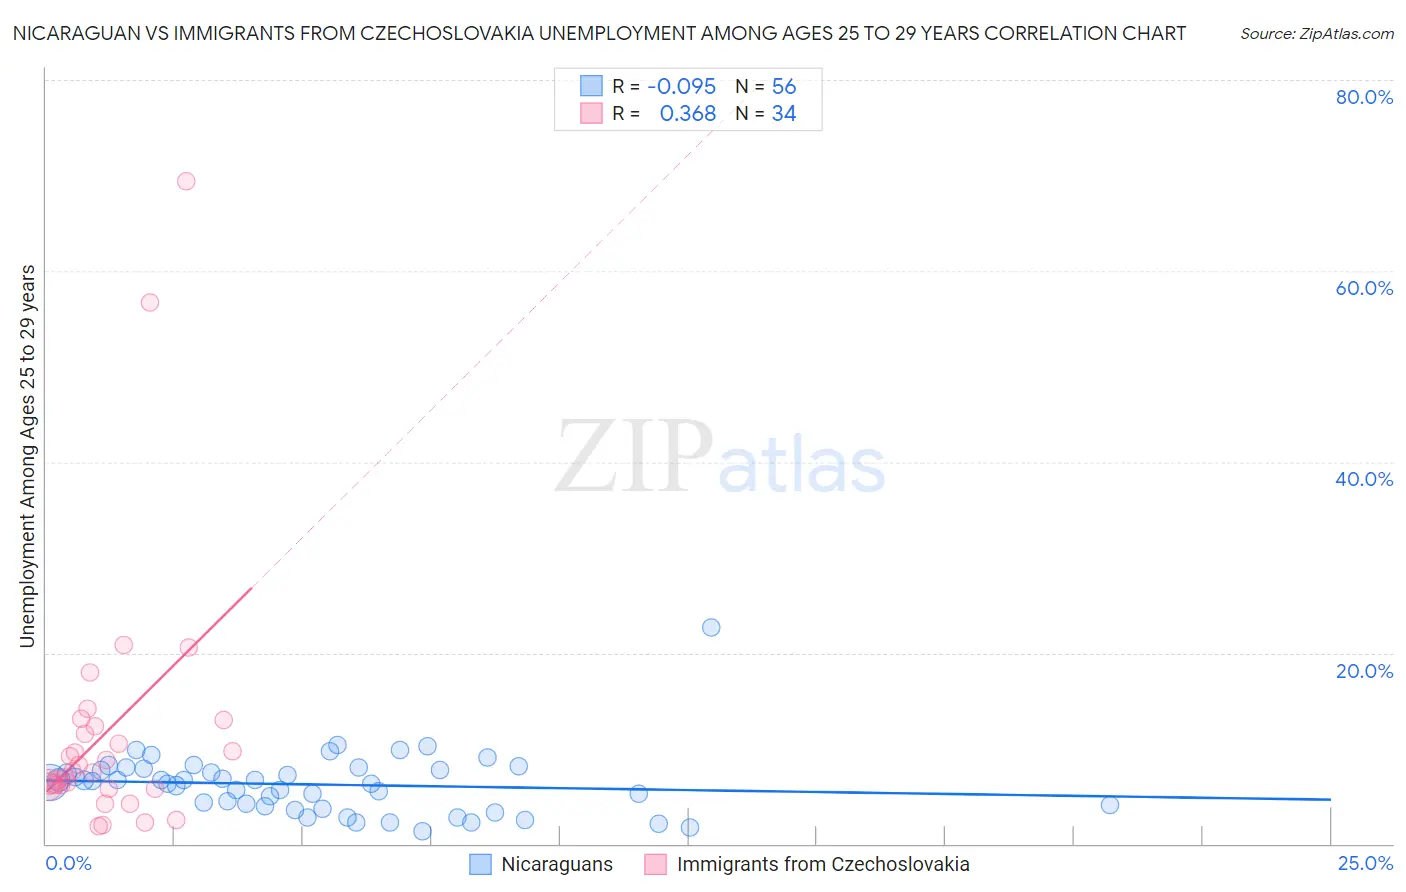
Nicaraguan vs Immigrants from Czechoslovakia Unemployment Among Ages 25 to 29 years Correlation Chart
The statistical analysis conducted on geographies consisting of 278,445,697 people shows a slight negative correlation between the proportion of Nicaraguans and unemployment rate among population between the ages 25 and 29 in the United States with a correlation coefficient (R) of -0.095 and weighted average of 6.6%. Similarly, the statistical analysis conducted on geographies consisting of 189,772,937 people shows a mild positive correlation between the proportion of Immigrants from Czechoslovakia and unemployment rate among population between the ages 25 and 29 in the United States with a correlation coefficient (R) of 0.368 and weighted average of 6.6%, a difference of 0.69%.
Unemployment Among Ages 25 to 29 years Correlation Summary
| Measurement | Nicaraguan | Immigrants from Czechoslovakia |
| Minimum | 1.3% | 1.8% |
| Maximum | 22.6% | 69.4% |
| Range | 21.3% | 67.5% |
| Mean | 6.2% | 11.8% |
| Median | 6.5% | 7.5% |
| Interquartile 25% (IQ1) | 4.0% | 6.1% |
| Interquartile 75% (IQ3) | 7.8% | 12.3% |
| Interquartile Range (IQR) | 3.8% | 6.1% |
| Standard Deviation (Sample) | 3.3% | 13.9% |
| Standard Deviation (Population) | 3.3% | 13.7% |
Demographics Similar to Nicaraguans and Immigrants from Czechoslovakia by Unemployment Among Ages 25 to 29 years
In terms of unemployment among ages 25 to 29 years, the demographic groups most similar to Nicaraguans are Romanian (6.6%, a difference of 0.050%), Immigrants from Micronesia (6.6%, a difference of 0.10%), Immigrants from Thailand (6.6%, a difference of 0.13%), Peruvian (6.6%, a difference of 0.15%), and Lithuanian (6.5%, a difference of 0.16%). Similarly, the demographic groups most similar to Immigrants from Czechoslovakia are Paraguayan (6.6%, a difference of 0.020%), Scottish (6.6%, a difference of 0.040%), Immigrants from Middle Africa (6.6%, a difference of 0.050%), Welsh (6.6%, a difference of 0.070%), and Immigrants from Russia (6.6%, a difference of 0.090%).
| Demographics | Rating | Rank | Unemployment Among Ages 25 to 29 years |
| Lithuanians | 72.2 /100 | #143 | Good 6.5% |
| Immigrants | Micronesia | 71.5 /100 | #144 | Good 6.6% |
| Nicaraguans | 70.2 /100 | #145 | Good 6.6% |
| Romanians | 69.5 /100 | #146 | Good 6.6% |
| Immigrants | Thailand | 68.4 /100 | #147 | Good 6.6% |
| Peruvians | 68.1 /100 | #148 | Good 6.6% |
| Malaysians | 67.1 /100 | #149 | Good 6.6% |
| Finns | 66.9 /100 | #150 | Good 6.6% |
| Ukrainians | 65.5 /100 | #151 | Good 6.6% |
| Samoans | 64.6 /100 | #152 | Good 6.6% |
| Immigrants | Italy | 64.4 /100 | #153 | Good 6.6% |
| Colombians | 64.0 /100 | #154 | Good 6.6% |
| Immigrants | Latvia | 63.9 /100 | #155 | Good 6.6% |
| Immigrants | Laos | 63.5 /100 | #156 | Good 6.6% |
| South Africans | 63.5 /100 | #157 | Good 6.6% |
| Immigrants | Russia | 61.5 /100 | #158 | Good 6.6% |
| Welsh | 61.3 /100 | #159 | Good 6.6% |
| Scottish | 60.7 /100 | #160 | Good 6.6% |
| Paraguayans | 60.4 /100 | #161 | Good 6.6% |
| Immigrants | Czechoslovakia | 60.2 /100 | #162 | Good 6.6% |
| Immigrants | Middle Africa | 59.4 /100 | #163 | Average 6.6% |