Nicaraguan vs Immigrants from North Macedonia Unemployment Among Ages 25 to 29 years
COMPARE
Nicaraguan
Immigrants from North Macedonia
Unemployment Among Ages 25 to 29 years
Unemployment Among Ages 25 to 29 years Comparison
Nicaraguans
Immigrants from North Macedonia
6.6%
UNEMPLOYMENT AMONG AGES 25 TO 29 YEARS
70.2/ 100
METRIC RATING
145th/ 347
METRIC RANK
6.4%
UNEMPLOYMENT AMONG AGES 25 TO 29 YEARS
93.6/ 100
METRIC RATING
92nd/ 347
METRIC RANK
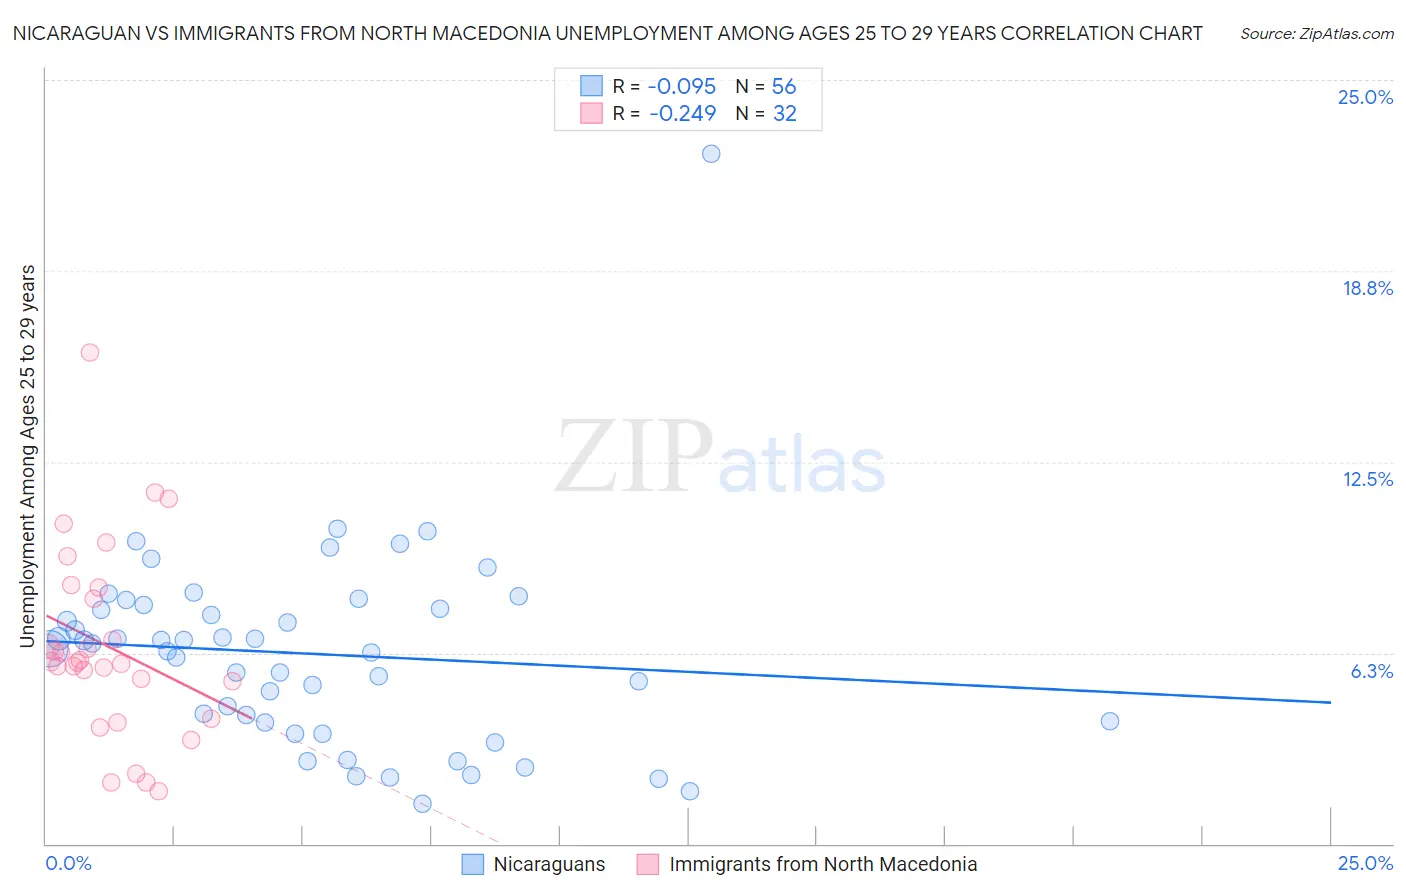
Nicaraguan vs Immigrants from North Macedonia Unemployment Among Ages 25 to 29 years Correlation Chart
The statistical analysis conducted on geographies consisting of 278,445,697 people shows a slight negative correlation between the proportion of Nicaraguans and unemployment rate among population between the ages 25 and 29 in the United States with a correlation coefficient (R) of -0.095 and weighted average of 6.6%. Similarly, the statistical analysis conducted on geographies consisting of 72,870,541 people shows a weak negative correlation between the proportion of Immigrants from North Macedonia and unemployment rate among population between the ages 25 and 29 in the United States with a correlation coefficient (R) of -0.249 and weighted average of 6.4%, a difference of 2.9%.
Unemployment Among Ages 25 to 29 years Correlation Summary
| Measurement | Nicaraguan | Immigrants from North Macedonia |
| Minimum | 1.3% | 1.7% |
| Maximum | 22.6% | 16.1% |
| Range | 21.3% | 14.4% |
| Mean | 6.2% | 6.5% |
| Median | 6.5% | 5.9% |
| Interquartile 25% (IQ1) | 4.0% | 4.7% |
| Interquartile 75% (IQ3) | 7.8% | 8.2% |
| Interquartile Range (IQR) | 3.8% | 3.5% |
| Standard Deviation (Sample) | 3.3% | 3.1% |
| Standard Deviation (Population) | 3.3% | 3.1% |
Similar Demographics by Unemployment Among Ages 25 to 29 years
Demographics Similar to Nicaraguans by Unemployment Among Ages 25 to 29 years
In terms of unemployment among ages 25 to 29 years, the demographic groups most similar to Nicaraguans are Romanian (6.6%, a difference of 0.050%), Immigrants from Micronesia (6.6%, a difference of 0.10%), Immigrants from Thailand (6.6%, a difference of 0.13%), Peruvian (6.6%, a difference of 0.15%), and Lithuanian (6.5%, a difference of 0.16%).
| Demographics | Rating | Rank | Unemployment Among Ages 25 to 29 years |
| Immigrants | Belgium | 73.8 /100 | #138 | Good 6.5% |
| Austrians | 73.8 /100 | #139 | Good 6.5% |
| Immigrants | Pakistan | 73.8 /100 | #140 | Good 6.5% |
| Maltese | 72.9 /100 | #141 | Good 6.5% |
| Slavs | 72.5 /100 | #142 | Good 6.5% |
| Lithuanians | 72.2 /100 | #143 | Good 6.5% |
| Immigrants | Micronesia | 71.5 /100 | #144 | Good 6.6% |
| Nicaraguans | 70.2 /100 | #145 | Good 6.6% |
| Romanians | 69.5 /100 | #146 | Good 6.6% |
| Immigrants | Thailand | 68.4 /100 | #147 | Good 6.6% |
| Peruvians | 68.1 /100 | #148 | Good 6.6% |
| Malaysians | 67.1 /100 | #149 | Good 6.6% |
| Finns | 66.9 /100 | #150 | Good 6.6% |
| Ukrainians | 65.5 /100 | #151 | Good 6.6% |
| Samoans | 64.6 /100 | #152 | Good 6.6% |
Demographics Similar to Immigrants from North Macedonia by Unemployment Among Ages 25 to 29 years
In terms of unemployment among ages 25 to 29 years, the demographic groups most similar to Immigrants from North Macedonia are Australian (6.4%, a difference of 0.0%), Zimbabwean (6.4%, a difference of 0.050%), Egyptian (6.4%, a difference of 0.060%), Lebanese (6.4%, a difference of 0.070%), and Immigrants from Oceania (6.4%, a difference of 0.14%).
| Demographics | Rating | Rank | Unemployment Among Ages 25 to 29 years |
| Immigrants | Sweden | 95.1 /100 | #85 | Exceptional 6.3% |
| Immigrants | Asia | 94.9 /100 | #86 | Exceptional 6.3% |
| Marshallese | 94.7 /100 | #87 | Exceptional 6.4% |
| Immigrants | Indonesia | 94.5 /100 | #88 | Exceptional 6.4% |
| Immigrants | Oceania | 94.1 /100 | #89 | Exceptional 6.4% |
| Lebanese | 93.9 /100 | #90 | Exceptional 6.4% |
| Egyptians | 93.9 /100 | #91 | Exceptional 6.4% |
| Immigrants | North Macedonia | 93.6 /100 | #92 | Exceptional 6.4% |
| Australians | 93.6 /100 | #93 | Exceptional 6.4% |
| Zimbabweans | 93.5 /100 | #94 | Exceptional 6.4% |
| Afghans | 92.5 /100 | #95 | Exceptional 6.4% |
| Immigrants | Brazil | 92.1 /100 | #96 | Exceptional 6.4% |
| Immigrants | Eastern Europe | 91.9 /100 | #97 | Exceptional 6.4% |
| Serbians | 91.7 /100 | #98 | Exceptional 6.4% |
| Iraqis | 91.3 /100 | #99 | Exceptional 6.4% |