Costa Rican vs Immigrants from Czechoslovakia Unemployment Among Ages 25 to 29 years
COMPARE
Costa Rican
Immigrants from Czechoslovakia
Unemployment Among Ages 25 to 29 years
Unemployment Among Ages 25 to 29 years Comparison
Costa Ricans
Immigrants from Czechoslovakia
6.7%
UNEMPLOYMENT AMONG AGES 25 TO 29 YEARS
44.9/ 100
METRIC RATING
179th/ 347
METRIC RANK
6.6%
UNEMPLOYMENT AMONG AGES 25 TO 29 YEARS
60.2/ 100
METRIC RATING
162nd/ 347
METRIC RANK
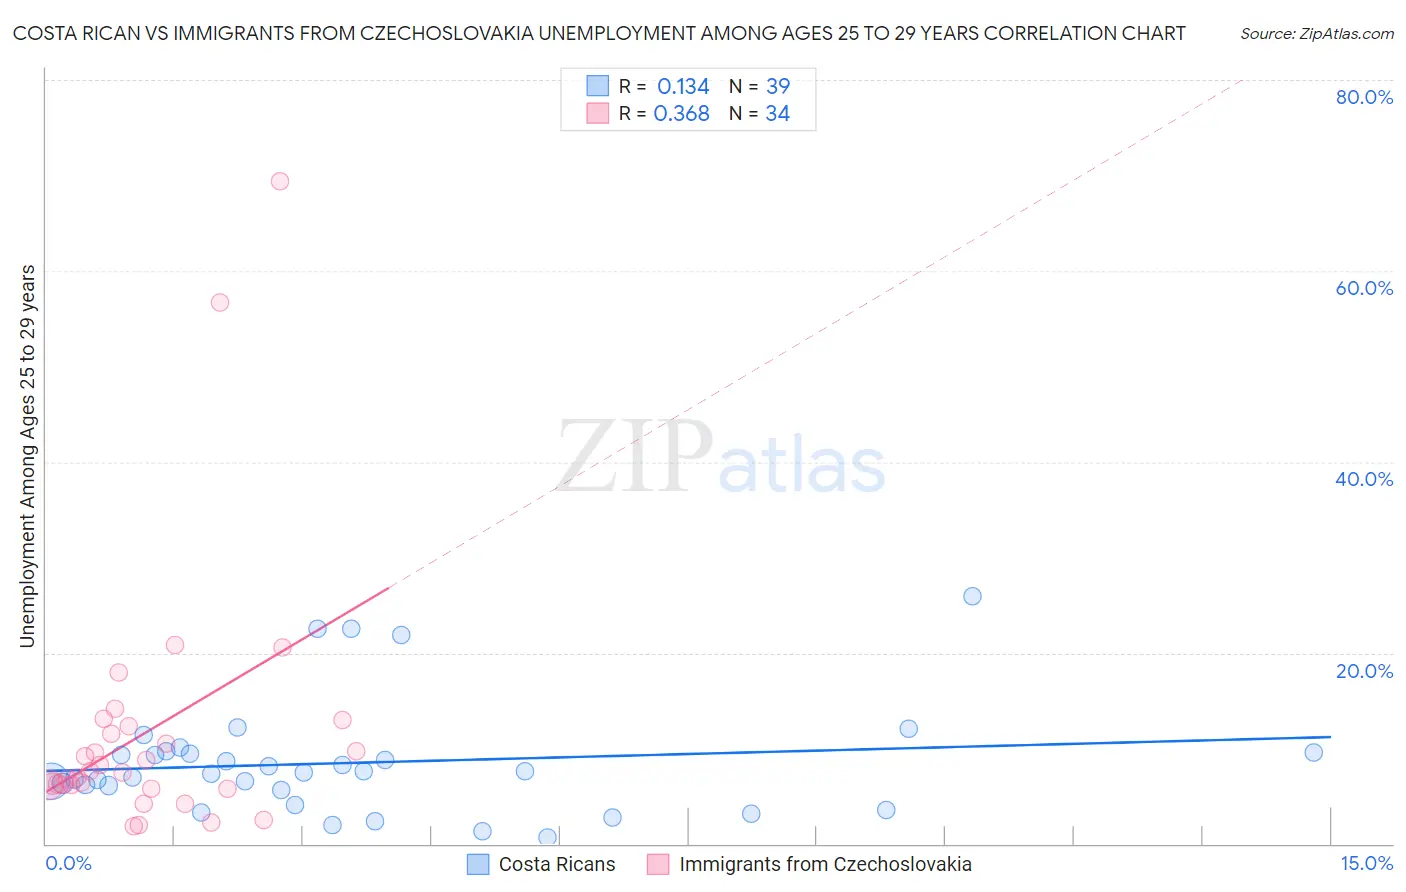
Costa Rican vs Immigrants from Czechoslovakia Unemployment Among Ages 25 to 29 years Correlation Chart
The statistical analysis conducted on geographies consisting of 247,127,898 people shows a poor positive correlation between the proportion of Costa Ricans and unemployment rate among population between the ages 25 and 29 in the United States with a correlation coefficient (R) of 0.134 and weighted average of 6.7%. Similarly, the statistical analysis conducted on geographies consisting of 189,772,937 people shows a mild positive correlation between the proportion of Immigrants from Czechoslovakia and unemployment rate among population between the ages 25 and 29 in the United States with a correlation coefficient (R) of 0.368 and weighted average of 6.6%, a difference of 0.95%.
Unemployment Among Ages 25 to 29 years Correlation Summary
| Measurement | Costa Rican | Immigrants from Czechoslovakia |
| Minimum | 0.60% | 1.8% |
| Maximum | 25.9% | 69.4% |
| Range | 25.3% | 67.5% |
| Mean | 8.5% | 11.8% |
| Median | 7.5% | 7.5% |
| Interquartile 25% (IQ1) | 5.6% | 6.1% |
| Interquartile 75% (IQ3) | 9.6% | 12.3% |
| Interquartile Range (IQR) | 4.0% | 6.1% |
| Standard Deviation (Sample) | 5.8% | 13.9% |
| Standard Deviation (Population) | 5.7% | 13.7% |
Demographics Similar to Costa Ricans and Immigrants from Czechoslovakia by Unemployment Among Ages 25 to 29 years
In terms of unemployment among ages 25 to 29 years, the demographic groups most similar to Costa Ricans are Immigrants from Iraq (6.7%, a difference of 0.010%), Immigrants from Israel (6.7%, a difference of 0.17%), Osage (6.7%, a difference of 0.19%), Immigrants from Africa (6.7%, a difference of 0.24%), and Immigrants from South Eastern Asia (6.7%, a difference of 0.26%). Similarly, the demographic groups most similar to Immigrants from Czechoslovakia are Paraguayan (6.6%, a difference of 0.020%), Scottish (6.6%, a difference of 0.040%), Immigrants from Middle Africa (6.6%, a difference of 0.050%), Greek (6.6%, a difference of 0.11%), and English (6.6%, a difference of 0.14%).
| Demographics | Rating | Rank | Unemployment Among Ages 25 to 29 years |
| Scottish | 60.7 /100 | #160 | Good 6.6% |
| Paraguayans | 60.4 /100 | #161 | Good 6.6% |
| Immigrants | Czechoslovakia | 60.2 /100 | #162 | Good 6.6% |
| Immigrants | Middle Africa | 59.4 /100 | #163 | Average 6.6% |
| Greeks | 58.5 /100 | #164 | Average 6.6% |
| English | 58.0 /100 | #165 | Average 6.6% |
| Immigrants | Northern Europe | 57.3 /100 | #166 | Average 6.6% |
| Immigrants | Canada | 55.0 /100 | #167 | Average 6.6% |
| Estonians | 54.8 /100 | #168 | Average 6.6% |
| South Americans | 54.5 /100 | #169 | Average 6.6% |
| Albanians | 53.5 /100 | #170 | Average 6.6% |
| Immigrants | Cambodia | 52.6 /100 | #171 | Average 6.6% |
| Bangladeshis | 51.6 /100 | #172 | Average 6.6% |
| Russians | 51.3 /100 | #173 | Average 6.6% |
| Immigrants | North America | 50.0 /100 | #174 | Average 6.6% |
| Immigrants | South Eastern Asia | 49.1 /100 | #175 | Average 6.7% |
| Osage | 48.1 /100 | #176 | Average 6.7% |
| Immigrants | Israel | 47.8 /100 | #177 | Average 6.7% |
| Immigrants | Iraq | 45.1 /100 | #178 | Average 6.7% |
| Costa Ricans | 44.9 /100 | #179 | Average 6.7% |
| Immigrants | Africa | 41.1 /100 | #180 | Average 6.7% |