Nepalese vs Japanese Unemployment Among Women with Children Ages 6 to 17 years
COMPARE
Nepalese
Japanese
Unemployment Among Women with Children Ages 6 to 17 years
Unemployment Among Women with Children Ages 6 to 17 years Comparison
Nepalese
Japanese
7.7%
UNEMPLOYMENT AMONG WOMEN WITH CHILDREN AGES 6 TO 17 YEARS
100.0/ 100
METRIC RATING
24th/ 347
METRIC RANK
8.4%
UNEMPLOYMENT AMONG WOMEN WITH CHILDREN AGES 6 TO 17 YEARS
99.5/ 100
METRIC RATING
84th/ 347
METRIC RANK
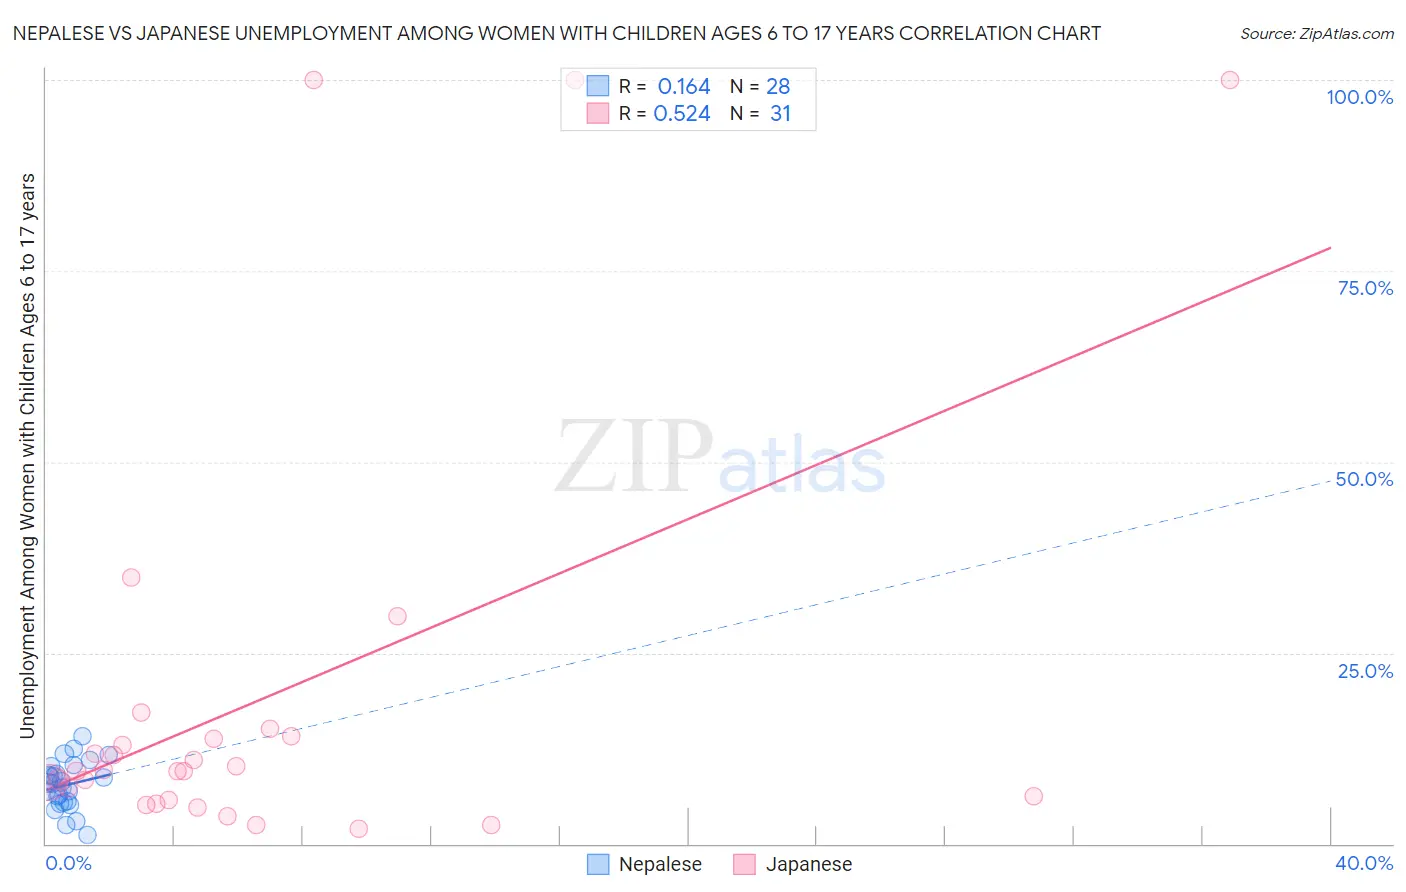
Nepalese vs Japanese Unemployment Among Women with Children Ages 6 to 17 years Correlation Chart
The statistical analysis conducted on geographies consisting of 22,673,047 people shows a poor positive correlation between the proportion of Nepalese and unemployment rate among women with children between the ages 6 and 17 in the United States with a correlation coefficient (R) of 0.164 and weighted average of 7.7%. Similarly, the statistical analysis conducted on geographies consisting of 199,688,096 people shows a substantial positive correlation between the proportion of Japanese and unemployment rate among women with children between the ages 6 and 17 in the United States with a correlation coefficient (R) of 0.524 and weighted average of 8.4%, a difference of 9.5%.
Unemployment Among Women with Children Ages 6 to 17 years Correlation Summary
| Measurement | Nepalese | Japanese |
| Minimum | 1.1% | 2.0% |
| Maximum | 14.1% | 100.0% |
| Range | 13.0% | 98.0% |
| Mean | 7.7% | 19.0% |
| Median | 7.9% | 9.5% |
| Interquartile 25% (IQ1) | 5.4% | 5.7% |
| Interquartile 75% (IQ3) | 9.6% | 14.1% |
| Interquartile Range (IQR) | 4.2% | 8.4% |
| Standard Deviation (Sample) | 3.1% | 27.8% |
| Standard Deviation (Population) | 3.0% | 27.4% |
Similar Demographics by Unemployment Among Women with Children Ages 6 to 17 years
Demographics Similar to Nepalese by Unemployment Among Women with Children Ages 6 to 17 years
In terms of unemployment among women with children ages 6 to 17 years, the demographic groups most similar to Nepalese are Immigrants from Indonesia (7.7%, a difference of 0.010%), Immigrants from Eastern Asia (7.7%, a difference of 0.12%), Indian (Asian) (7.7%, a difference of 0.13%), Immigrants from China (7.7%, a difference of 0.39%), and Immigrants from India (7.7%, a difference of 0.68%).
| Demographics | Rating | Rank | Unemployment Among Women with Children Ages 6 to 17 years |
| Cambodians | 100.0 /100 | #17 | Exceptional 7.5% |
| Afghans | 100.0 /100 | #18 | Exceptional 7.6% |
| Filipinos | 100.0 /100 | #19 | Exceptional 7.6% |
| Immigrants | Singapore | 100.0 /100 | #20 | Exceptional 7.7% |
| Immigrants | India | 100.0 /100 | #21 | Exceptional 7.7% |
| Immigrants | China | 100.0 /100 | #22 | Exceptional 7.7% |
| Immigrants | Indonesia | 100.0 /100 | #23 | Exceptional 7.7% |
| Nepalese | 100.0 /100 | #24 | Exceptional 7.7% |
| Immigrants | Eastern Asia | 100.0 /100 | #25 | Exceptional 7.7% |
| Indians (Asian) | 100.0 /100 | #26 | Exceptional 7.7% |
| Immigrants | Afghanistan | 100.0 /100 | #27 | Exceptional 7.8% |
| Immigrants | Uzbekistan | 100.0 /100 | #28 | Exceptional 7.8% |
| Thais | 100.0 /100 | #29 | Exceptional 7.8% |
| Immigrants | Iran | 100.0 /100 | #30 | Exceptional 7.9% |
| Laotians | 100.0 /100 | #31 | Exceptional 7.9% |
Demographics Similar to Japanese by Unemployment Among Women with Children Ages 6 to 17 years
In terms of unemployment among women with children ages 6 to 17 years, the demographic groups most similar to Japanese are Immigrants from North Macedonia (8.5%, a difference of 0.040%), Bulgarian (8.4%, a difference of 0.12%), Alaskan Athabascan (8.5%, a difference of 0.19%), Cypriot (8.4%, a difference of 0.28%), and Immigrants from Bolivia (8.4%, a difference of 0.30%).
| Demographics | Rating | Rank | Unemployment Among Women with Children Ages 6 to 17 years |
| Iraqis | 99.7 /100 | #77 | Exceptional 8.4% |
| Pakistanis | 99.6 /100 | #78 | Exceptional 8.4% |
| Mongolians | 99.6 /100 | #79 | Exceptional 8.4% |
| Immigrants | Belarus | 99.6 /100 | #80 | Exceptional 8.4% |
| Immigrants | Bolivia | 99.6 /100 | #81 | Exceptional 8.4% |
| Cypriots | 99.6 /100 | #82 | Exceptional 8.4% |
| Bulgarians | 99.5 /100 | #83 | Exceptional 8.4% |
| Japanese | 99.5 /100 | #84 | Exceptional 8.4% |
| Immigrants | North Macedonia | 99.4 /100 | #85 | Exceptional 8.5% |
| Alaskan Athabascans | 99.4 /100 | #86 | Exceptional 8.5% |
| Immigrants | Israel | 99.1 /100 | #87 | Exceptional 8.5% |
| Immigrants | Vietnam | 99.1 /100 | #88 | Exceptional 8.5% |
| Paiute | 99.1 /100 | #89 | Exceptional 8.5% |
| Yugoslavians | 99.0 /100 | #90 | Exceptional 8.5% |
| Immigrants | Eastern Europe | 99.0 /100 | #91 | Exceptional 8.5% |