Immigrants from Turkey vs Japanese Unemployment Among Women with Children Ages 6 to 17 years
COMPARE
Immigrants from Turkey
Japanese
Unemployment Among Women with Children Ages 6 to 17 years
Unemployment Among Women with Children Ages 6 to 17 years Comparison
Immigrants from Turkey
Japanese
9.1%
UNEMPLOYMENT AMONG WOMEN WITH CHILDREN AGES 6 TO 17 YEARS
25.8/ 100
METRIC RATING
193rd/ 347
METRIC RANK
8.4%
UNEMPLOYMENT AMONG WOMEN WITH CHILDREN AGES 6 TO 17 YEARS
99.5/ 100
METRIC RATING
84th/ 347
METRIC RANK
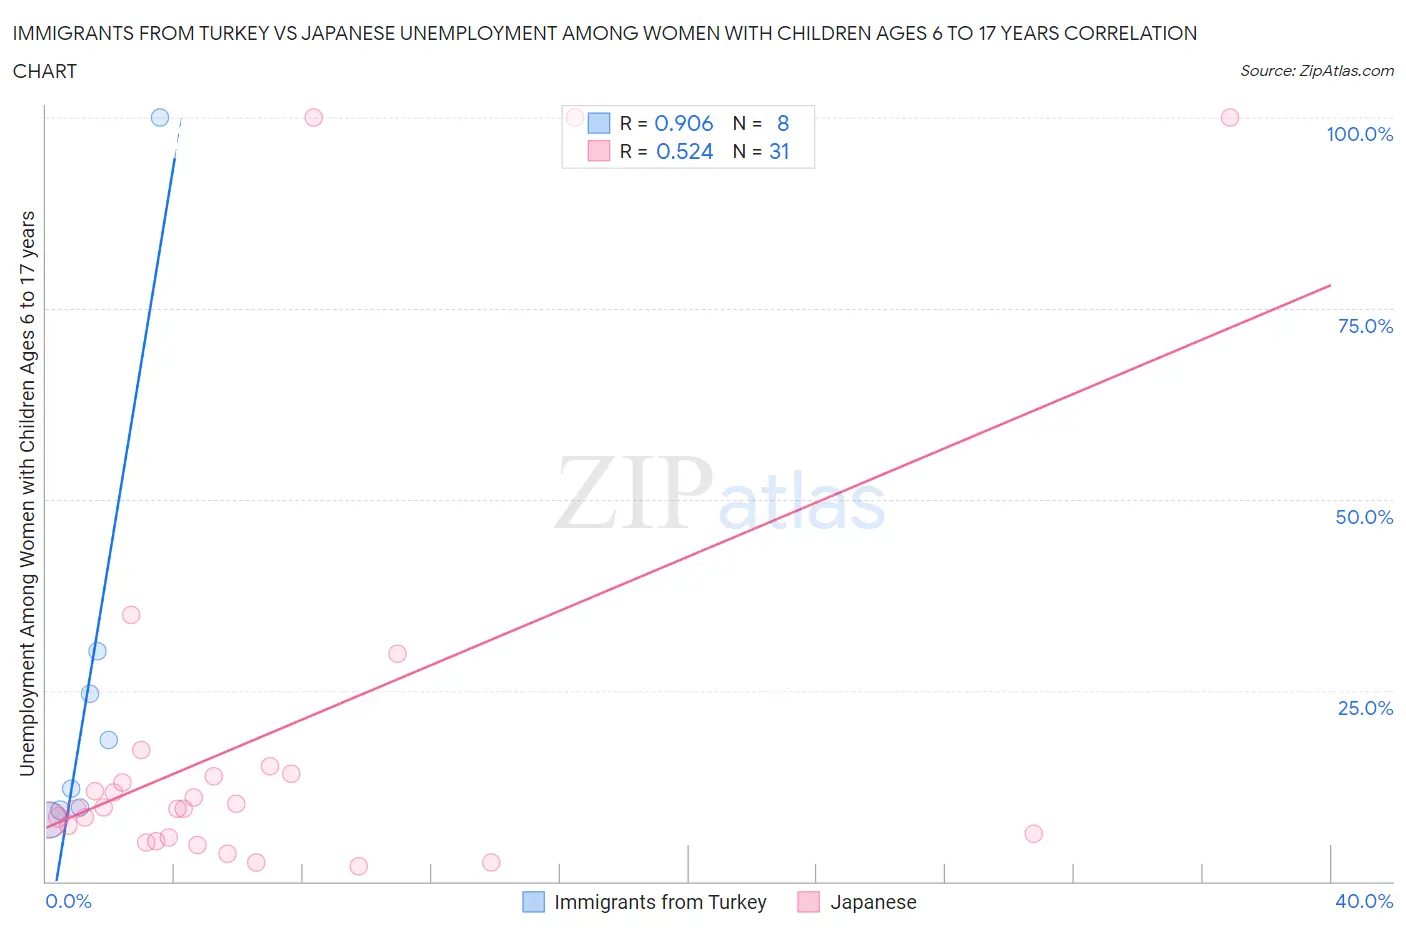
Immigrants from Turkey vs Japanese Unemployment Among Women with Children Ages 6 to 17 years Correlation Chart
The statistical analysis conducted on geographies consisting of 175,776,961 people shows a near-perfect positive correlation between the proportion of Immigrants from Turkey and unemployment rate among women with children between the ages 6 and 17 in the United States with a correlation coefficient (R) of 0.906 and weighted average of 9.1%. Similarly, the statistical analysis conducted on geographies consisting of 199,688,096 people shows a substantial positive correlation between the proportion of Japanese and unemployment rate among women with children between the ages 6 and 17 in the United States with a correlation coefficient (R) of 0.524 and weighted average of 8.4%, a difference of 7.4%.
Unemployment Among Women with Children Ages 6 to 17 years Correlation Summary
| Measurement | Immigrants from Turkey | Japanese |
| Minimum | 8.1% | 2.0% |
| Maximum | 100.0% | 100.0% |
| Range | 91.9% | 98.0% |
| Mean | 26.5% | 19.0% |
| Median | 15.3% | 9.5% |
| Interquartile 25% (IQ1) | 9.5% | 5.7% |
| Interquartile 75% (IQ3) | 27.3% | 14.1% |
| Interquartile Range (IQR) | 17.8% | 8.4% |
| Standard Deviation (Sample) | 30.7% | 27.8% |
| Standard Deviation (Population) | 28.7% | 27.4% |
Similar Demographics by Unemployment Among Women with Children Ages 6 to 17 years
Demographics Similar to Immigrants from Turkey by Unemployment Among Women with Children Ages 6 to 17 years
In terms of unemployment among women with children ages 6 to 17 years, the demographic groups most similar to Immigrants from Turkey are Immigrants from Kazakhstan (9.1%, a difference of 0.030%), Austrian (9.1%, a difference of 0.050%), Guamanian/Chamorro (9.1%, a difference of 0.070%), Brazilian (9.1%, a difference of 0.080%), and Immigrants from Panama (9.1%, a difference of 0.090%).
| Demographics | Rating | Rank | Unemployment Among Women with Children Ages 6 to 17 years |
| Immigrants | Spain | 32.4 /100 | #186 | Fair 9.0% |
| Comanche | 30.0 /100 | #187 | Fair 9.0% |
| Immigrants | Syria | 29.7 /100 | #188 | Fair 9.1% |
| Immigrants | Immigrants | 29.2 /100 | #189 | Fair 9.1% |
| Slovenes | 28.5 /100 | #190 | Fair 9.1% |
| Belizeans | 28.4 /100 | #191 | Fair 9.1% |
| Guamanians/Chamorros | 27.2 /100 | #192 | Fair 9.1% |
| Immigrants | Turkey | 25.8 /100 | #193 | Fair 9.1% |
| Immigrants | Kazakhstan | 25.3 /100 | #194 | Fair 9.1% |
| Austrians | 25.0 /100 | #195 | Fair 9.1% |
| Brazilians | 24.4 /100 | #196 | Fair 9.1% |
| Immigrants | Panama | 24.3 /100 | #197 | Fair 9.1% |
| Guyanese | 21.8 /100 | #198 | Fair 9.1% |
| Czechoslovakians | 20.8 /100 | #199 | Fair 9.1% |
| Trinidadians and Tobagonians | 18.2 /100 | #200 | Poor 9.1% |
Demographics Similar to Japanese by Unemployment Among Women with Children Ages 6 to 17 years
In terms of unemployment among women with children ages 6 to 17 years, the demographic groups most similar to Japanese are Immigrants from North Macedonia (8.5%, a difference of 0.040%), Bulgarian (8.4%, a difference of 0.12%), Alaskan Athabascan (8.5%, a difference of 0.19%), Cypriot (8.4%, a difference of 0.28%), and Immigrants from Bolivia (8.4%, a difference of 0.30%).
| Demographics | Rating | Rank | Unemployment Among Women with Children Ages 6 to 17 years |
| Iraqis | 99.7 /100 | #77 | Exceptional 8.4% |
| Pakistanis | 99.6 /100 | #78 | Exceptional 8.4% |
| Mongolians | 99.6 /100 | #79 | Exceptional 8.4% |
| Immigrants | Belarus | 99.6 /100 | #80 | Exceptional 8.4% |
| Immigrants | Bolivia | 99.6 /100 | #81 | Exceptional 8.4% |
| Cypriots | 99.6 /100 | #82 | Exceptional 8.4% |
| Bulgarians | 99.5 /100 | #83 | Exceptional 8.4% |
| Japanese | 99.5 /100 | #84 | Exceptional 8.4% |
| Immigrants | North Macedonia | 99.4 /100 | #85 | Exceptional 8.5% |
| Alaskan Athabascans | 99.4 /100 | #86 | Exceptional 8.5% |
| Immigrants | Israel | 99.1 /100 | #87 | Exceptional 8.5% |
| Immigrants | Vietnam | 99.1 /100 | #88 | Exceptional 8.5% |
| Paiute | 99.1 /100 | #89 | Exceptional 8.5% |
| Yugoslavians | 99.0 /100 | #90 | Exceptional 8.5% |
| Immigrants | Eastern Europe | 99.0 /100 | #91 | Exceptional 8.5% |