Nepalese vs Choctaw Unemployment Among Youth under 25 years
COMPARE
Nepalese
Choctaw
Unemployment Among Youth under 25 years
Unemployment Among Youth under 25 years Comparison
Nepalese
Choctaw
12.5%
UNEMPLOYMENT AMONG YOUTH UNDER 25 YEARS
0.0/ 100
METRIC RATING
265th/ 347
METRIC RANK
12.1%
UNEMPLOYMENT AMONG YOUTH UNDER 25 YEARS
1.9/ 100
METRIC RATING
230th/ 347
METRIC RANK
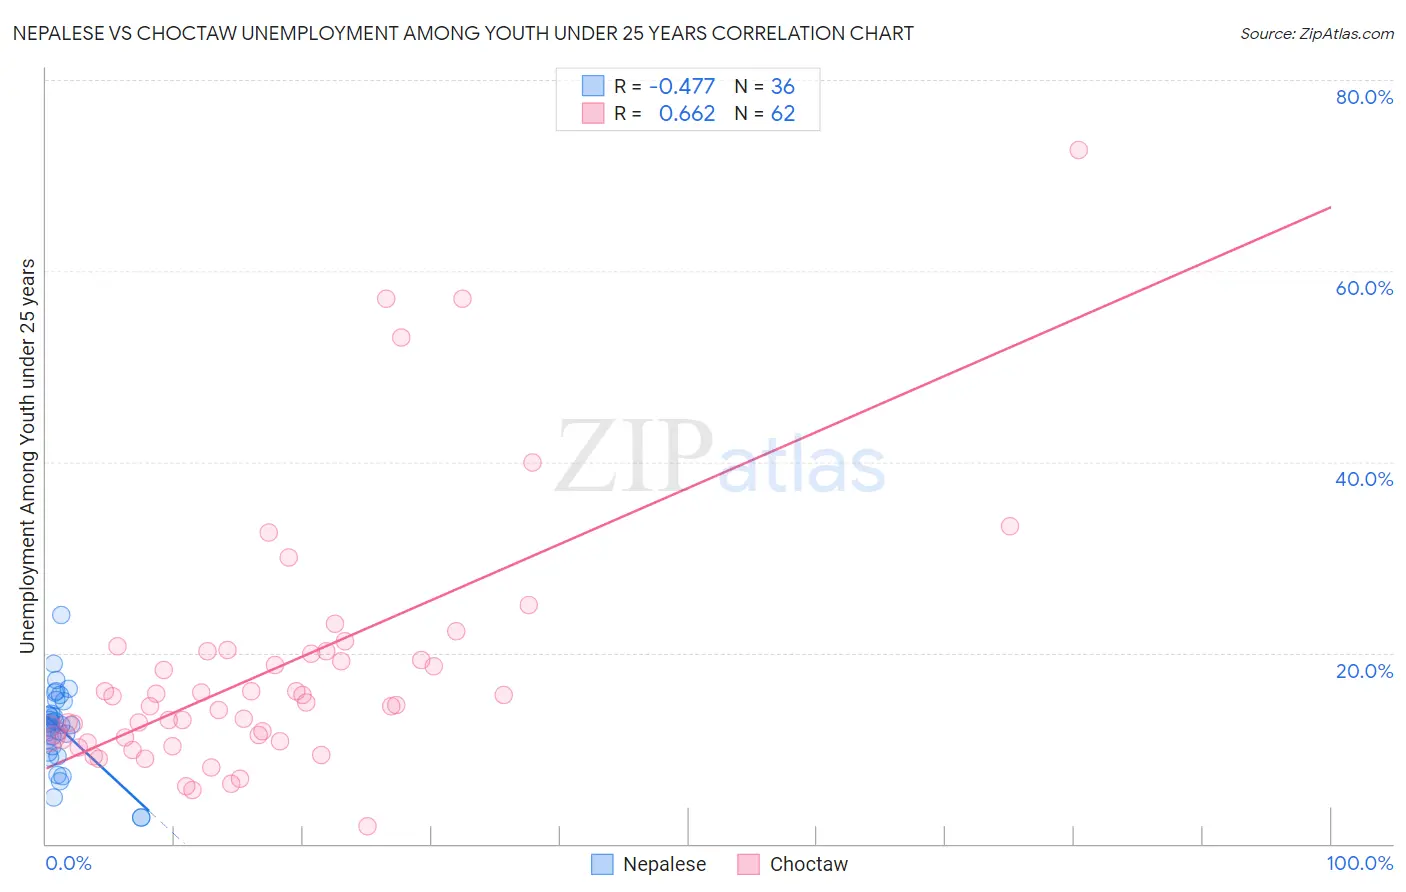
Nepalese vs Choctaw Unemployment Among Youth under 25 years Correlation Chart
The statistical analysis conducted on geographies consisting of 24,503,705 people shows a moderate negative correlation between the proportion of Nepalese and unemployment rate among youth under the age of 25 in the United States with a correlation coefficient (R) of -0.477 and weighted average of 12.5%. Similarly, the statistical analysis conducted on geographies consisting of 266,328,025 people shows a significant positive correlation between the proportion of Choctaw and unemployment rate among youth under the age of 25 in the United States with a correlation coefficient (R) of 0.662 and weighted average of 12.1%, a difference of 3.7%.
Unemployment Among Youth under 25 years Correlation Summary
| Measurement | Nepalese | Choctaw |
| Minimum | 2.7% | 1.8% |
| Maximum | 23.9% | 72.7% |
| Range | 21.2% | 70.9% |
| Mean | 12.1% | 18.2% |
| Median | 12.4% | 14.7% |
| Interquartile 25% (IQ1) | 9.8% | 10.9% |
| Interquartile 75% (IQ3) | 14.3% | 20.1% |
| Interquartile Range (IQR) | 4.4% | 9.2% |
| Standard Deviation (Sample) | 4.3% | 13.1% |
| Standard Deviation (Population) | 4.2% | 13.0% |
Similar Demographics by Unemployment Among Youth under 25 years
Demographics Similar to Nepalese by Unemployment Among Youth under 25 years
In terms of unemployment among youth under 25 years, the demographic groups most similar to Nepalese are Puget Sound Salish (12.5%, a difference of 0.10%), Cree (12.4%, a difference of 0.57%), Immigrants from Mexico (12.4%, a difference of 0.66%), Immigrants from El Salvador (12.4%, a difference of 0.71%), and Immigrants from Panama (12.4%, a difference of 0.73%).
| Demographics | Rating | Rank | Unemployment Among Youth under 25 years |
| Salvadorans | 0.1 /100 | #258 | Tragic 12.4% |
| Immigrants | Central America | 0.1 /100 | #259 | Tragic 12.4% |
| Immigrants | Panama | 0.1 /100 | #260 | Tragic 12.4% |
| Immigrants | El Salvador | 0.1 /100 | #261 | Tragic 12.4% |
| Immigrants | Mexico | 0.1 /100 | #262 | Tragic 12.4% |
| Cree | 0.1 /100 | #263 | Tragic 12.4% |
| Puget Sound Salish | 0.1 /100 | #264 | Tragic 12.5% |
| Nepalese | 0.0 /100 | #265 | Tragic 12.5% |
| Immigrants | Latin America | 0.0 /100 | #266 | Tragic 12.6% |
| Sub-Saharan Africans | 0.0 /100 | #267 | Tragic 12.6% |
| Tlingit-Haida | 0.0 /100 | #268 | Tragic 12.7% |
| Kiowa | 0.0 /100 | #269 | Tragic 12.7% |
| Immigrants | Liberia | 0.0 /100 | #270 | Tragic 12.8% |
| Immigrants | Bahamas | 0.0 /100 | #271 | Tragic 12.9% |
| Cape Verdeans | 0.0 /100 | #272 | Tragic 12.9% |
Demographics Similar to Choctaw by Unemployment Among Youth under 25 years
In terms of unemployment among youth under 25 years, the demographic groups most similar to Choctaw are Moroccan (12.1%, a difference of 0.050%), Immigrants from Fiji (12.1%, a difference of 0.060%), Immigrants from South America (12.1%, a difference of 0.10%), Immigrants from Belarus (12.1%, a difference of 0.17%), and South American Indian (12.1%, a difference of 0.19%).
| Demographics | Rating | Rank | Unemployment Among Youth under 25 years |
| Immigrants | Ireland | 3.5 /100 | #223 | Tragic 12.0% |
| Hawaiians | 3.5 /100 | #224 | Tragic 12.0% |
| Immigrants | Ukraine | 3.0 /100 | #225 | Tragic 12.0% |
| Immigrants | Israel | 2.6 /100 | #226 | Tragic 12.0% |
| Immigrants | Iran | 2.6 /100 | #227 | Tragic 12.0% |
| Immigrants | Fiji | 2.1 /100 | #228 | Tragic 12.1% |
| Moroccans | 2.1 /100 | #229 | Tragic 12.1% |
| Choctaw | 1.9 /100 | #230 | Tragic 12.1% |
| Immigrants | South America | 1.8 /100 | #231 | Tragic 12.1% |
| Immigrants | Belarus | 1.6 /100 | #232 | Tragic 12.1% |
| South American Indians | 1.6 /100 | #233 | Tragic 12.1% |
| Guatemalans | 1.4 /100 | #234 | Tragic 12.1% |
| Immigrants | Guatemala | 1.4 /100 | #235 | Tragic 12.1% |
| Immigrants | Immigrants | 1.3 /100 | #236 | Tragic 12.1% |
| Native Hawaiians | 1.3 /100 | #237 | Tragic 12.1% |