Nepalese vs Spanish American Unemployment Among Youth under 25 years
COMPARE
Nepalese
Spanish American
Unemployment Among Youth under 25 years
Unemployment Among Youth under 25 years Comparison
Nepalese
Spanish Americans
12.5%
UNEMPLOYMENT AMONG YOUTH UNDER 25 YEARS
0.0/ 100
METRIC RATING
265th/ 347
METRIC RANK
12.2%
UNEMPLOYMENT AMONG YOUTH UNDER 25 YEARS
0.6/ 100
METRIC RATING
245th/ 347
METRIC RANK
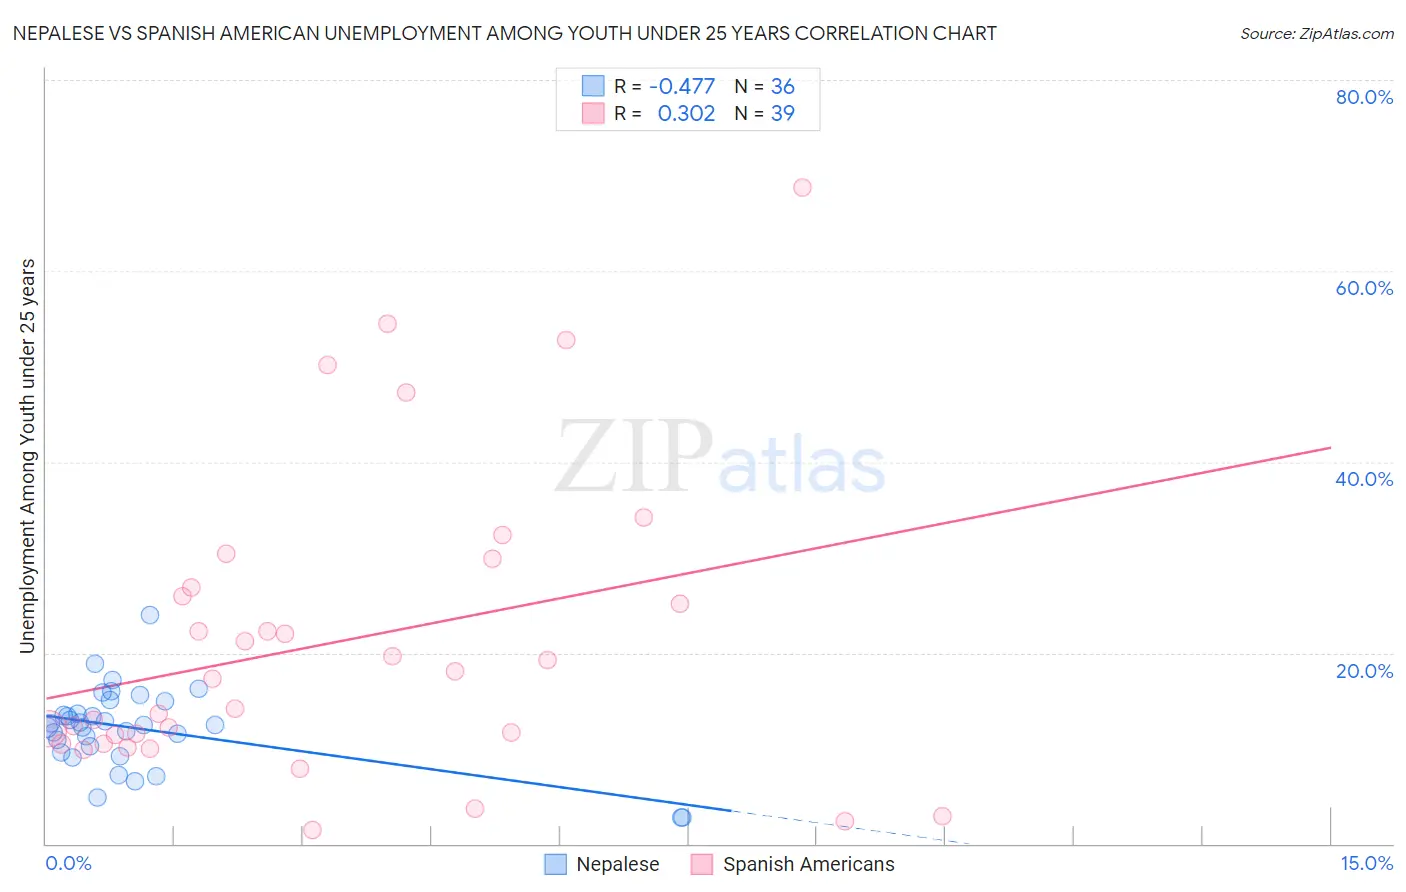
Nepalese vs Spanish American Unemployment Among Youth under 25 years Correlation Chart
The statistical analysis conducted on geographies consisting of 24,503,705 people shows a moderate negative correlation between the proportion of Nepalese and unemployment rate among youth under the age of 25 in the United States with a correlation coefficient (R) of -0.477 and weighted average of 12.5%. Similarly, the statistical analysis conducted on geographies consisting of 102,840,374 people shows a mild positive correlation between the proportion of Spanish Americans and unemployment rate among youth under the age of 25 in the United States with a correlation coefficient (R) of 0.302 and weighted average of 12.2%, a difference of 2.5%.
Unemployment Among Youth under 25 years Correlation Summary
| Measurement | Nepalese | Spanish American |
| Minimum | 2.7% | 1.5% |
| Maximum | 23.9% | 68.7% |
| Range | 21.2% | 67.2% |
| Mean | 12.1% | 21.1% |
| Median | 12.4% | 17.3% |
| Interquartile 25% (IQ1) | 9.8% | 10.5% |
| Interquartile 75% (IQ3) | 14.3% | 26.8% |
| Interquartile Range (IQR) | 4.4% | 16.3% |
| Standard Deviation (Sample) | 4.3% | 15.6% |
| Standard Deviation (Population) | 4.2% | 15.4% |
Demographics Similar to Nepalese and Spanish Americans by Unemployment Among Youth under 25 years
In terms of unemployment among youth under 25 years, the demographic groups most similar to Nepalese are Puget Sound Salish (12.5%, a difference of 0.10%), Cree (12.4%, a difference of 0.57%), Immigrants from Mexico (12.4%, a difference of 0.66%), Immigrants from El Salvador (12.4%, a difference of 0.71%), and Immigrants from Panama (12.4%, a difference of 0.73%). Similarly, the demographic groups most similar to Spanish Americans are Immigrants from Honduras (12.2%, a difference of 0.0%), Immigrants from Greece (12.2%, a difference of 0.11%), Central American (12.2%, a difference of 0.13%), Soviet Union (12.2%, a difference of 0.14%), and Delaware (12.3%, a difference of 0.56%).
| Demographics | Rating | Rank | Unemployment Among Youth under 25 years |
| Spanish Americans | 0.6 /100 | #245 | Tragic 12.2% |
| Immigrants | Honduras | 0.6 /100 | #246 | Tragic 12.2% |
| Immigrants | Greece | 0.6 /100 | #247 | Tragic 12.2% |
| Central Americans | 0.6 /100 | #248 | Tragic 12.2% |
| Soviet Union | 0.6 /100 | #249 | Tragic 12.2% |
| Delaware | 0.4 /100 | #250 | Tragic 12.3% |
| Mexican American Indians | 0.4 /100 | #251 | Tragic 12.3% |
| Immigrants | Syria | 0.3 /100 | #252 | Tragic 12.3% |
| Mexicans | 0.3 /100 | #253 | Tragic 12.3% |
| Hondurans | 0.3 /100 | #254 | Tragic 12.3% |
| Hispanics or Latinos | 0.2 /100 | #255 | Tragic 12.4% |
| Liberians | 0.2 /100 | #256 | Tragic 12.4% |
| Panamanians | 0.2 /100 | #257 | Tragic 12.4% |
| Salvadorans | 0.1 /100 | #258 | Tragic 12.4% |
| Immigrants | Central America | 0.1 /100 | #259 | Tragic 12.4% |
| Immigrants | Panama | 0.1 /100 | #260 | Tragic 12.4% |
| Immigrants | El Salvador | 0.1 /100 | #261 | Tragic 12.4% |
| Immigrants | Mexico | 0.1 /100 | #262 | Tragic 12.4% |
| Cree | 0.1 /100 | #263 | Tragic 12.4% |
| Puget Sound Salish | 0.1 /100 | #264 | Tragic 12.5% |
| Nepalese | 0.0 /100 | #265 | Tragic 12.5% |