Navajo vs Immigrants from Yemen Unemployment Among Ages 30 to 34 years
COMPARE
Navajo
Immigrants from Yemen
Unemployment Among Ages 30 to 34 years
Unemployment Among Ages 30 to 34 years Comparison
Navajo
Immigrants from Yemen
10.6%
UNEMPLOYMENT AMONG AGES 30 TO 34 YEARS
0.0/ 100
METRIC RATING
341st/ 347
METRIC RANK
7.3%
UNEMPLOYMENT AMONG AGES 30 TO 34 YEARS
0.0/ 100
METRIC RATING
323rd/ 347
METRIC RANK
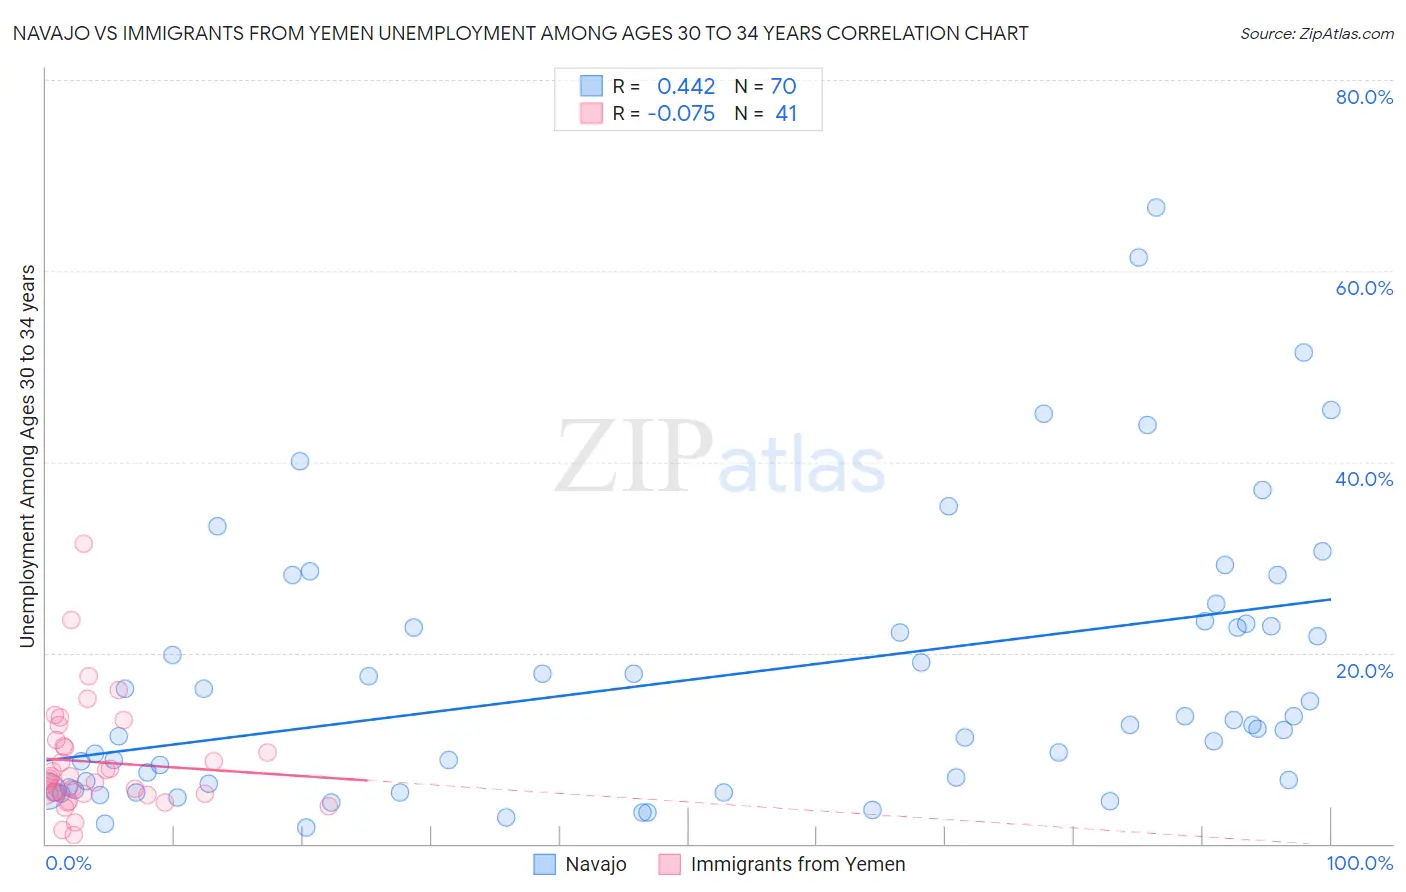
Navajo vs Immigrants from Yemen Unemployment Among Ages 30 to 34 years Correlation Chart
The statistical analysis conducted on geographies consisting of 217,031,350 people shows a moderate positive correlation between the proportion of Navajo and unemployment rate among population between the ages 30 and 34 in the United States with a correlation coefficient (R) of 0.442 and weighted average of 10.6%. Similarly, the statistical analysis conducted on geographies consisting of 81,630,994 people shows a slight negative correlation between the proportion of Immigrants from Yemen and unemployment rate among population between the ages 30 and 34 in the United States with a correlation coefficient (R) of -0.075 and weighted average of 7.3%, a difference of 45.0%.
Unemployment Among Ages 30 to 34 years Correlation Summary
| Measurement | Navajo | Immigrants from Yemen |
| Minimum | 1.7% | 0.90% |
| Maximum | 66.7% | 31.4% |
| Range | 65.0% | 30.5% |
| Mean | 17.4% | 8.6% |
| Median | 12.5% | 6.8% |
| Interquartile 25% (IQ1) | 5.9% | 5.2% |
| Interquartile 75% (IQ3) | 23.1% | 10.5% |
| Interquartile Range (IQR) | 17.2% | 5.3% |
| Standard Deviation (Sample) | 14.5% | 5.9% |
| Standard Deviation (Population) | 14.4% | 5.8% |
Demographics Similar to Navajo and Immigrants from Yemen by Unemployment Among Ages 30 to 34 years
In terms of unemployment among ages 30 to 34 years, the demographic groups most similar to Navajo are Yuman (10.6%, a difference of 0.40%), Crow (10.3%, a difference of 2.0%), Tohono O'odham (9.8%, a difference of 7.3%), Yakama (9.8%, a difference of 8.1%), and Pima (9.6%, a difference of 9.3%). Similarly, the demographic groups most similar to Immigrants from Yemen are Marshallese (7.2%, a difference of 0.46%), Immigrants from Dominica (7.3%, a difference of 0.59%), Apache (7.3%, a difference of 0.86%), Dominican (7.7%, a difference of 5.6%), and Immigrants from Dominican Republic (7.7%, a difference of 6.3%).
| Demographics | Rating | Rank | Unemployment Among Ages 30 to 34 years |
| Marshallese | 0.0 /100 | #322 | Tragic 7.2% |
| Immigrants | Yemen | 0.0 /100 | #323 | Tragic 7.3% |
| Immigrants | Dominica | 0.0 /100 | #324 | Tragic 7.3% |
| Apache | 0.0 /100 | #325 | Tragic 7.3% |
| Dominicans | 0.0 /100 | #326 | Tragic 7.7% |
| Immigrants | Dominican Republic | 0.0 /100 | #327 | Tragic 7.7% |
| Chippewa | 0.0 /100 | #328 | Tragic 7.8% |
| Cheyenne | 0.0 /100 | #329 | Tragic 7.8% |
| Shoshone | 0.0 /100 | #330 | Tragic 7.9% |
| Sioux | 0.0 /100 | #331 | Tragic 8.0% |
| Natives/Alaskans | 0.0 /100 | #332 | Tragic 8.2% |
| Pueblo | 0.0 /100 | #333 | Tragic 8.3% |
| Alaska Natives | 0.0 /100 | #334 | Tragic 8.5% |
| Puerto Ricans | 0.0 /100 | #335 | Tragic 8.9% |
| Colville | 0.0 /100 | #336 | Tragic 9.0% |
| Pima | 0.0 /100 | #337 | Tragic 9.6% |
| Yakama | 0.0 /100 | #338 | Tragic 9.8% |
| Tohono O'odham | 0.0 /100 | #339 | Tragic 9.8% |
| Crow | 0.0 /100 | #340 | Tragic 10.3% |
| Navajo | 0.0 /100 | #341 | Tragic 10.6% |
| Yuman | 0.0 /100 | #342 | Tragic 10.6% |