Nonimmigrants vs Zimbabwean Unemployment Among Ages 16 to 19 years

COMPARE

Nonimmigrants
Race
Ancestry
AfghanAfricanAlaska NativeAlaskan AthabascanAlbanianAleutAlsatianAmericanApacheArabArapahoArgentineanArmenianAssyrian/Chaldean/SyriacAustralianAustrianBahamianBangladeshiBarbadianBasqueBelgianBelizeanBermudanBhutaneseBlackfeetBolivianBrazilianBritishBritish West IndianBulgarianBurmeseCajunCambodianCanadianCape VerdeanCarpatho RusynCelticCentral AmericanCentral American IndianCherokeeCheyenneChickasawChileanChineseChippewaChoctawColombianColvilleComancheCosta RicanCreeCreekCroatianCrowCubanCypriotCzechCzechoslovakianDanishDelawareDominicanDutchDutch West IndianEastern EuropeanEcuadorianEgyptianEnglishEstonianEthiopianEuropeanFijianFilipinoFinnishFrenchFrench American IndianFrench CanadianGermanGerman RussianGhanaianGreekGuamanian/ChamorroGuatemalanGuyaneseHaitianHmongHonduranHopiHoumaHungarianIcelanderIndian (Asian)IndonesianInupiatIranianIraqiIrishIroquoisIsraeliItalianJamaicanJapaneseJordanianKenyanKiowaKoreanLaotianLatvianLebaneseLiberianLithuanianLumbeeLuxembourgerMacedonianMalaysianMalteseMarshalleseMenomineeMexicanMexican American IndianMongolianMoroccanNative HawaiianNavajoNepaleseNew ZealanderNicaraguanNigerianNorthern EuropeanNorwegianOkinawanOsageOttawaPaiutePakistaniPalestinianPanamanianParaguayanPennsylvania GermanPeruvianPimaPolishPortuguesePotawatomiPuebloPuerto RicanPuget Sound SalishRomanianRussianSalvadoranSamoanScandinavianScotch-IrishScottishSeminoleSenegaleseSerbianShoshoneSierra LeoneanSiouxSlavicSlovakSloveneSomaliSouth AfricanSouth AmericanSouth American IndianSoviet UnionSpaniardSpanishSpanish AmericanSpanish American IndianSri LankanSubsaharan AfricanSudaneseSwedishSwissSyrianTaiwaneseThaiTlingit-HaidaTohono O'OdhamTonganTrinidadian and TobagonianTsimshianTurkishU.S. Virgin IslanderUgandanUkrainianUruguayanUteVenezuelanVietnameseWelshWest IndianYakamaYaquiYugoslavianYumanYup'ik
Immigration
NonimmigrantsImmigrantsAfghanistanAfricaAlbaniaArgentinaArmeniaAsiaAustraliaAustriaBahamasBangladeshBarbadosBelarusBelgiumBelizeBoliviaBosnia and HerzegovinaBrazilBulgariaBurma/MyanmarCabo VerdeCambodiaCameroonCanadaCaribbeanCentral AmericaChileChinaColombiaCongoCosta RicaCroatiaCubaCzechoslovakiaDenmarkDominicaDominican RepublicEastern AfricaEastern AsiaEastern EuropeEcuadorEgyptEl SalvadorEnglandEritreaEthiopiaEuropeFijiFranceGermanyGhanaGreeceGrenadaGuatemalaGuyanaHaitiHondurasHong KongHungaryIndiaIndonesiaIranIraqIrelandIsraelItalyJamaicaJapanJordanKazakhstanKenyaKoreaKuwaitLaosLatin AmericaLatviaLebanonLiberiaLithuaniaMalaysiaMexicoMicronesiaMiddle AfricaMoldovaMoroccoNepalNetherlandsNicaraguaNigeriaNorth AmericaNorth MacedoniaNorthern AfricaNorthern EuropeNorwayOceaniaPakistanPanamaPeruPhilippinesPolandPortugalRomaniaRussiaSaudi ArabiaScotlandSenegalSerbiaSierra LeoneSingaporeSomaliaSouth AfricaSouth AmericaSouth Central AsiaSouth Eastern AsiaSouthern EuropeSpainSri LankaSt. Vincent and the GrenadinesSudanSwedenSwitzerlandSyriaTaiwanThailandTrinidad and TobagoTurkeyUgandaUkraineUruguayUzbekistanVenezuelaVietnamWest IndiesWestern AfricaWestern AsiaWestern EuropeYemenZaireZimbabweAzores
Zimbabwean
Race
Ancestry
AfghanAfricanAlaska NativeAlaskan AthabascanAlbanianAleutAlsatianAmericanApacheArabArapahoArgentineanArmenianAssyrian/Chaldean/SyriacAustralianAustrianBahamianBangladeshiBarbadianBasqueBelgianBelizeanBermudanBhutaneseBlackfeetBolivianBrazilianBritishBritish West IndianBulgarianBurmeseCajunCambodianCanadianCape VerdeanCarpatho RusynCelticCentral AmericanCentral American IndianCherokeeCheyenneChickasawChileanChineseChippewaChoctawColombianColvilleComancheCosta RicanCreeCreekCroatianCrowCubanCypriotCzechCzechoslovakianDanishDelawareDominicanDutchDutch West IndianEastern EuropeanEcuadorianEgyptianEnglishEstonianEthiopianEuropeanFijianFilipinoFinnishFrenchFrench American IndianFrench CanadianGermanGerman RussianGhanaianGreekGuamanian/ChamorroGuatemalanGuyaneseHaitianHmongHonduranHopiHoumaHungarianIcelanderIndian (Asian)IndonesianInupiatIranianIraqiIrishIroquoisIsraeliItalianJamaicanJapaneseJordanianKenyanKiowaKoreanLaotianLatvianLebaneseLiberianLithuanianLumbeeLuxembourgerMacedonianMalaysianMalteseMarshalleseMenomineeMexicanMexican American IndianMongolianMoroccanNative HawaiianNavajoNepaleseNew ZealanderNicaraguanNigerianNorthern EuropeanNorwegianOkinawanOsageOttawaPaiutePakistaniPalestinianPanamanianParaguayanPennsylvania GermanPeruvianPimaPolishPortuguesePotawatomiPuebloPuerto RicanPuget Sound SalishRomanianRussianSalvadoranSamoanScandinavianScotch-IrishScottishSeminoleSenegaleseSerbianShoshoneSierra LeoneanSiouxSlavicSlovakSloveneSomaliSouth AfricanSouth AmericanSouth American IndianSoviet UnionSpaniardSpanishSpanish AmericanSpanish American IndianSri LankanSubsaharan AfricanSudaneseSwedishSwissSyrianTaiwaneseThaiTlingit-HaidaTohono O'OdhamTonganTrinidadian and TobagonianTsimshianTurkishU.S. Virgin IslanderUgandanUkrainianUruguayanUteVenezuelanVietnameseWelshWest IndianYakamaYaquiYugoslavianYumanYup'ikZimbabwean
Immigration
ImmigrantsAfghanistanAfricaAlbaniaArgentinaArmeniaAsiaAustraliaAustriaBahamasBangladeshBarbadosBelarusBelgiumBelizeBoliviaBosnia and HerzegovinaBrazilBulgariaBurma/MyanmarCabo VerdeCambodiaCameroonCanadaCaribbeanCentral AmericaChileChinaColombiaCongoCosta RicaCroatiaCubaCzechoslovakiaDenmarkDominicaDominican RepublicEastern AfricaEastern AsiaEastern EuropeEcuadorEgyptEl SalvadorEnglandEritreaEthiopiaEuropeFijiFranceGermanyGhanaGreeceGrenadaGuatemalaGuyanaHaitiHondurasHong KongHungaryIndiaIndonesiaIranIraqIrelandIsraelItalyJamaicaJapanJordanKazakhstanKenyaKoreaKuwaitLaosLatin AmericaLatviaLebanonLiberiaLithuaniaMalaysiaMexicoMicronesiaMiddle AfricaMoldovaMoroccoNepalNetherlandsNicaraguaNigeriaNorth AmericaNorth MacedoniaNorthern AfricaNorthern EuropeNorwayOceaniaPakistanPanamaPeruPhilippinesPolandPortugalRomaniaRussiaSaudi ArabiaScotlandSenegalSerbiaSierra LeoneSingaporeSomaliaSouth AfricaSouth AmericaSouth Central AsiaSouth Eastern AsiaSouthern EuropeSpainSri LankaSt. Vincent and the GrenadinesSudanSwedenSwitzerlandSyriaTaiwanThailandTrinidad and TobagoTurkeyUgandaUkraineUruguayUzbekistanVenezuelaVietnamWest IndiesWestern AfricaWestern AsiaWestern EuropeYemenZaireZimbabweAzores
Unemployment Among Ages 16 to 19 years
Income
Poverty
Unemployment
Labor Participation
Family Structure
Vehicle Availability
Education Level
Disability

Unemployment Among Ages 16 to 19 years Comparison

Nonimmigrants

Zimbabweans

Fair
Exceptional
17.9%
UNEMPLOYMENT AMONG AGES 16 TO 19 YEARS
20.9/ 100
METRIC RATING
204th/ 347
METRIC RANK
15.4%
UNEMPLOYMENT AMONG AGES 16 TO 19 YEARS
100.0/ 100
METRIC RATING
10th/ 347
METRIC RANK

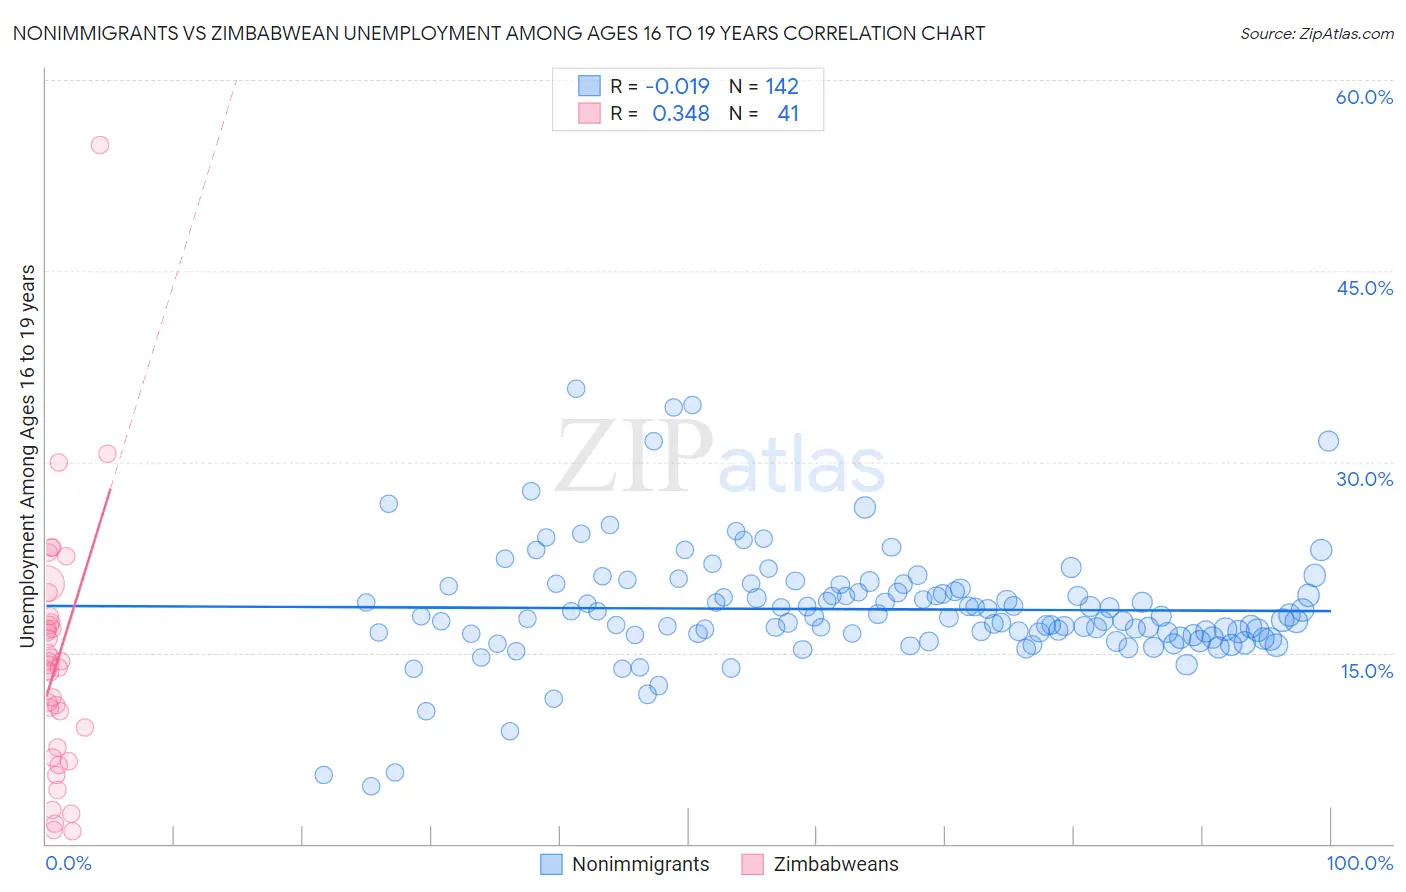
Nonimmigrants vs Zimbabwean Unemployment Among Ages 16 to 19 years Correlation Chart

The statistical analysis conducted on geographies consisting of 514,861,282 people shows no correlation between the proportion of Nonimmigrants and unemployment rate among population between the ages 16 and 19 in the United States with a correlation coefficient (R) of -0.019 and weighted average of 17.9%. Similarly, the statistical analysis conducted on geographies consisting of 68,440,311 people shows a mild positive correlation between the proportion of Zimbabweans and unemployment rate among population between the ages 16 and 19 in the United States with a correlation coefficient (R) of 0.348 and weighted average of 15.4%, a difference of 15.6%.
Nonimmigrants vs Zimbabwean Unemployment Among Ages 16 to 19 years

Unemployment Among Ages 16 to 19 years Correlation Summary

MeasurementNonimmigrantsZimbabwean
Minimum4.5%1.0%
Maximum35.7%54.9%
Range31.2%53.9%
Mean18.4%14.4%
Median17.7%14.0%
Interquartile 25% (IQ1)16.4%7.2%
Interquartile 75% (IQ3)19.8%17.6%
Interquartile Range (IQR)3.4%10.4%
Standard Deviation (Sample)4.6%9.8%
Standard Deviation (Population)4.6%9.7%

Similar Demographics by Unemployment Among Ages 16 to 19 years

Demographics Similar to Nonimmigrants by Unemployment Among Ages 16 to 19 years

In terms of unemployment among ages 16 to 19 years, the demographic groups most similar to Nonimmigrants are Assyrian/Chaldean/Syriac (17.9%, a difference of 0.010%), Immigrants from Southern Europe (17.9%, a difference of 0.15%), Liberian (17.9%, a difference of 0.16%), Immigrants from Eastern Europe (17.8%, a difference of 0.18%), and Hawaiian (17.9%, a difference of 0.31%).
DemographicsRating | RankUnemployment Among Ages 16 to 19 years
Immigrants | Czechoslovakia
29.8
/100
|
#197
Fair
17.8%
Ethiopians
29.6
/100
|
#198
Fair
17.8%
Immigrants | Ireland
28.5
/100
|
#199
Fair
17.8%
Immigrants | Fiji
27.7
/100
|
#200
Fair
17.8%
Immigrants | Ethiopia
27.4
/100
|
#201
Fair
17.8%
Immigrants | Portugal
27.2
/100
|
#202
Fair
17.8%
Immigrants | Eastern Europe
23.6
/100
|
#203
Fair
17.8%
Immigrants | Nonimmigrants
20.9
/100
|
#204
Fair
17.9%
Assyrians/Chaldeans/Syriacs
20.8
/100
|
#205
Fair
17.9%
Immigrants | Southern Europe
18.9
/100
|
#206
Poor
17.9%
Liberians
18.6
/100
|
#207
Poor
17.9%
Hawaiians
16.8
/100
|
#208
Poor
17.9%
Cherokee
15.7
/100
|
#209
Poor
17.9%
Carpatho Rusyns
15.6
/100
|
#210
Poor
17.9%
Guamanians/Chamorros
14.5
/100
|
#211
Poor
17.9%

Demographics Similar to Zimbabweans by Unemployment Among Ages 16 to 19 years

In terms of unemployment among ages 16 to 19 years, the demographic groups most similar to Zimbabweans are Scandinavian (15.4%, a difference of 0.11%), Indonesian (15.5%, a difference of 0.42%), Czech (15.4%, a difference of 0.44%), Taiwanese (15.5%, a difference of 0.52%), and Immigrants from Bosnia and Herzegovina (15.3%, a difference of 0.68%).
DemographicsRating | RankUnemployment Among Ages 16 to 19 years
Luxembourgers
100.0
/100
|
#3
Exceptional
15.1%
Danes
100.0
/100
|
#4
Exceptional
15.2%
Immigrants | Somalia
100.0
/100
|
#5
Exceptional
15.3%
Swedes
100.0
/100
|
#6
Exceptional
15.3%
Immigrants | Bosnia and Herzegovina
100.0
/100
|
#7
Exceptional
15.3%
Czechs
100.0
/100
|
#8
Exceptional
15.4%
Scandinavians
100.0
/100
|
#9
Exceptional
15.4%
Zimbabweans
100.0
/100
|
#10
Exceptional
15.4%
Indonesians
100.0
/100
|
#11
Exceptional
15.5%
Taiwanese
100.0
/100
|
#12
Exceptional
15.5%
Immigrants | Burma/Myanmar
100.0
/100
|
#13
Exceptional
15.6%
Immigrants | Zaire
100.0
/100
|
#14
Exceptional
15.6%
Yugoslavians
100.0
/100
|
#15
Exceptional
15.6%
Germans
100.0
/100
|
#16
Exceptional
15.7%
Somalis
100.0
/100
|
#17
Exceptional
15.7%