Native/Alaskan vs Immigrants from Dominica Unemployment Among Ages 60 to 64 years
COMPARE
Native/Alaskan
Immigrants from Dominica
Unemployment Among Ages 60 to 64 years
Unemployment Among Ages 60 to 64 years Comparison
Natives/Alaskans
Immigrants from Dominica
5.7%
UNEMPLOYMENT AMONG AGES 60 TO 64 YEARS
0.0/ 100
METRIC RATING
318th/ 347
METRIC RANK
5.4%
UNEMPLOYMENT AMONG AGES 60 TO 64 YEARS
0.0/ 100
METRIC RATING
306th/ 347
METRIC RANK
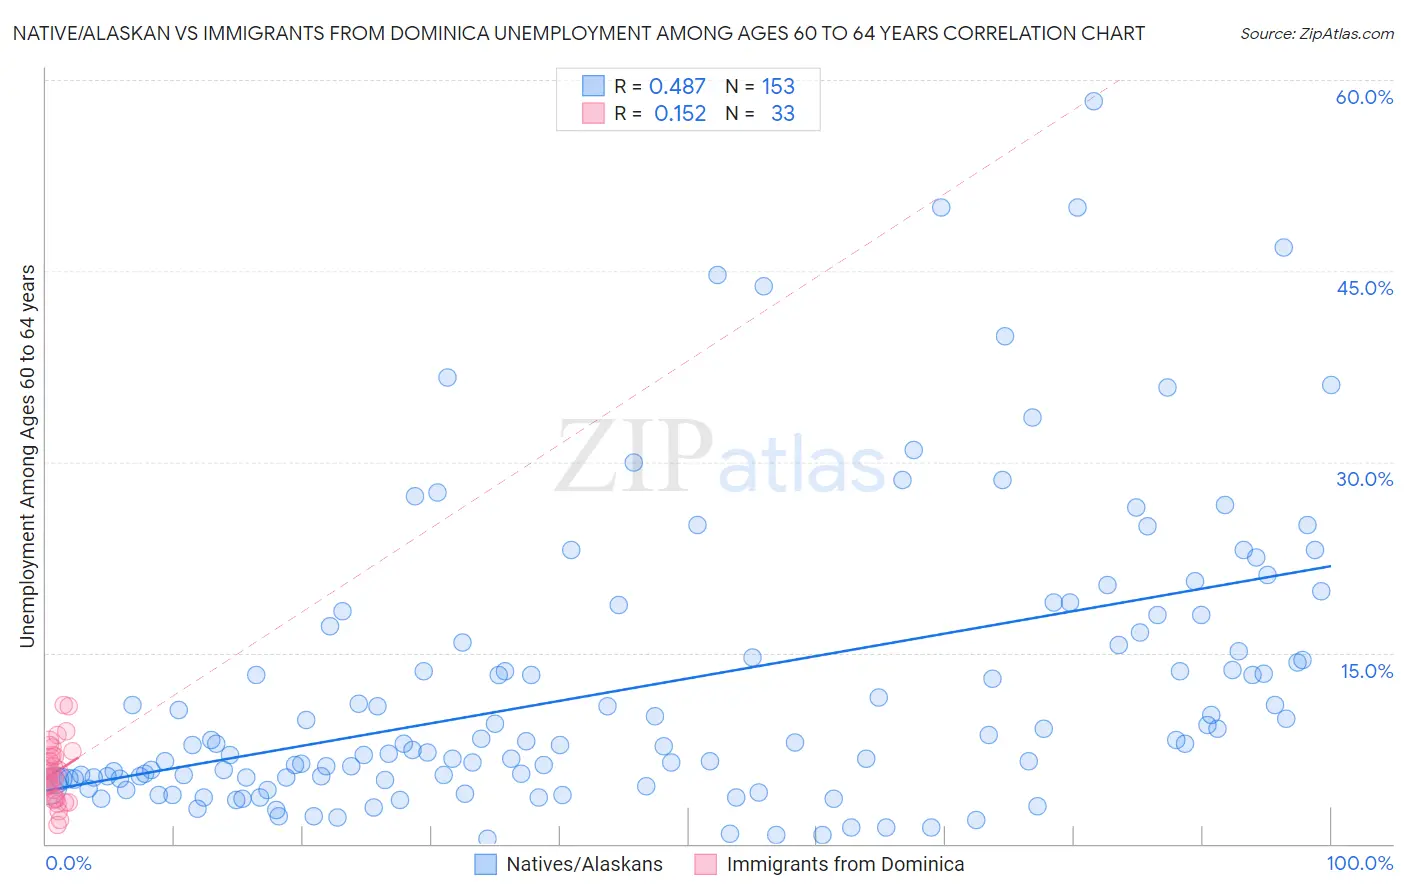
Native/Alaskan vs Immigrants from Dominica Unemployment Among Ages 60 to 64 years Correlation Chart
The statistical analysis conducted on geographies consisting of 437,522,212 people shows a moderate positive correlation between the proportion of Natives/Alaskans and unemployment rate among population between the ages 60 and 64 in the United States with a correlation coefficient (R) of 0.487 and weighted average of 5.7%. Similarly, the statistical analysis conducted on geographies consisting of 81,886,214 people shows a poor positive correlation between the proportion of Immigrants from Dominica and unemployment rate among population between the ages 60 and 64 in the United States with a correlation coefficient (R) of 0.152 and weighted average of 5.4%, a difference of 4.8%.
Unemployment Among Ages 60 to 64 years Correlation Summary
| Measurement | Native/Alaskan | Immigrants from Dominica |
| Minimum | 0.40% | 1.5% |
| Maximum | 58.3% | 10.9% |
| Range | 57.9% | 9.4% |
| Mean | 12.4% | 5.6% |
| Median | 7.9% | 5.5% |
| Interquartile 25% (IQ1) | 5.1% | 3.5% |
| Interquartile 75% (IQ3) | 16.2% | 7.1% |
| Interquartile Range (IQR) | 11.1% | 3.6% |
| Standard Deviation (Sample) | 11.4% | 2.3% |
| Standard Deviation (Population) | 11.3% | 2.3% |
Demographics Similar to Natives/Alaskans and Immigrants from Dominica by Unemployment Among Ages 60 to 64 years
In terms of unemployment among ages 60 to 64 years, the demographic groups most similar to Natives/Alaskans are Shoshone (5.7%, a difference of 0.050%), Immigrants from Belize (5.7%, a difference of 0.49%), Cheyenne (5.6%, a difference of 0.91%), Colville (5.7%, a difference of 1.3%), and Cree (5.6%, a difference of 1.3%). Similarly, the demographic groups most similar to Immigrants from Dominica are Cypriot (5.4%, a difference of 0.070%), Immigrants from Mexico (5.4%, a difference of 0.090%), Bahamian (5.4%, a difference of 0.14%), Immigrants from Guyana (5.4%, a difference of 0.17%), and Spanish American Indian (5.4%, a difference of 0.18%).
| Demographics | Rating | Rank | Unemployment Among Ages 60 to 64 years |
| Barbadians | 0.0 /100 | #302 | Tragic 5.4% |
| Bahamians | 0.0 /100 | #303 | Tragic 5.4% |
| Immigrants | Mexico | 0.0 /100 | #304 | Tragic 5.4% |
| Cypriots | 0.0 /100 | #305 | Tragic 5.4% |
| Immigrants | Dominica | 0.0 /100 | #306 | Tragic 5.4% |
| Immigrants | Guyana | 0.0 /100 | #307 | Tragic 5.4% |
| Spanish American Indians | 0.0 /100 | #308 | Tragic 5.4% |
| Soviet Union | 0.0 /100 | #309 | Tragic 5.4% |
| British West Indians | 0.0 /100 | #310 | Tragic 5.5% |
| U.S. Virgin Islanders | 0.0 /100 | #311 | Tragic 5.5% |
| Immigrants | West Indies | 0.0 /100 | #312 | Tragic 5.5% |
| Belizeans | 0.0 /100 | #313 | Tragic 5.5% |
| Guyanese | 0.0 /100 | #314 | Tragic 5.5% |
| Cree | 0.0 /100 | #315 | Tragic 5.6% |
| Cheyenne | 0.0 /100 | #316 | Tragic 5.6% |
| Shoshone | 0.0 /100 | #317 | Tragic 5.7% |
| Natives/Alaskans | 0.0 /100 | #318 | Tragic 5.7% |
| Immigrants | Belize | 0.0 /100 | #319 | Tragic 5.7% |
| Colville | 0.0 /100 | #320 | Tragic 5.7% |
| Dutch West Indians | 0.0 /100 | #321 | Tragic 5.7% |
| Ecuadorians | 0.0 /100 | #322 | Tragic 5.8% |