Native Hawaiian vs Immigrants from Western Europe Unemployment Among Ages 60 to 64 years
COMPARE
Native Hawaiian
Immigrants from Western Europe
Unemployment Among Ages 60 to 64 years
Unemployment Among Ages 60 to 64 years Comparison
Native Hawaiians
Immigrants from Western Europe
4.5%
UNEMPLOYMENT AMONG AGES 60 TO 64 YEARS
100.0/ 100
METRIC RATING
38th/ 347
METRIC RANK
4.9%
UNEMPLOYMENT AMONG AGES 60 TO 64 YEARS
50.0/ 100
METRIC RATING
174th/ 347
METRIC RANK
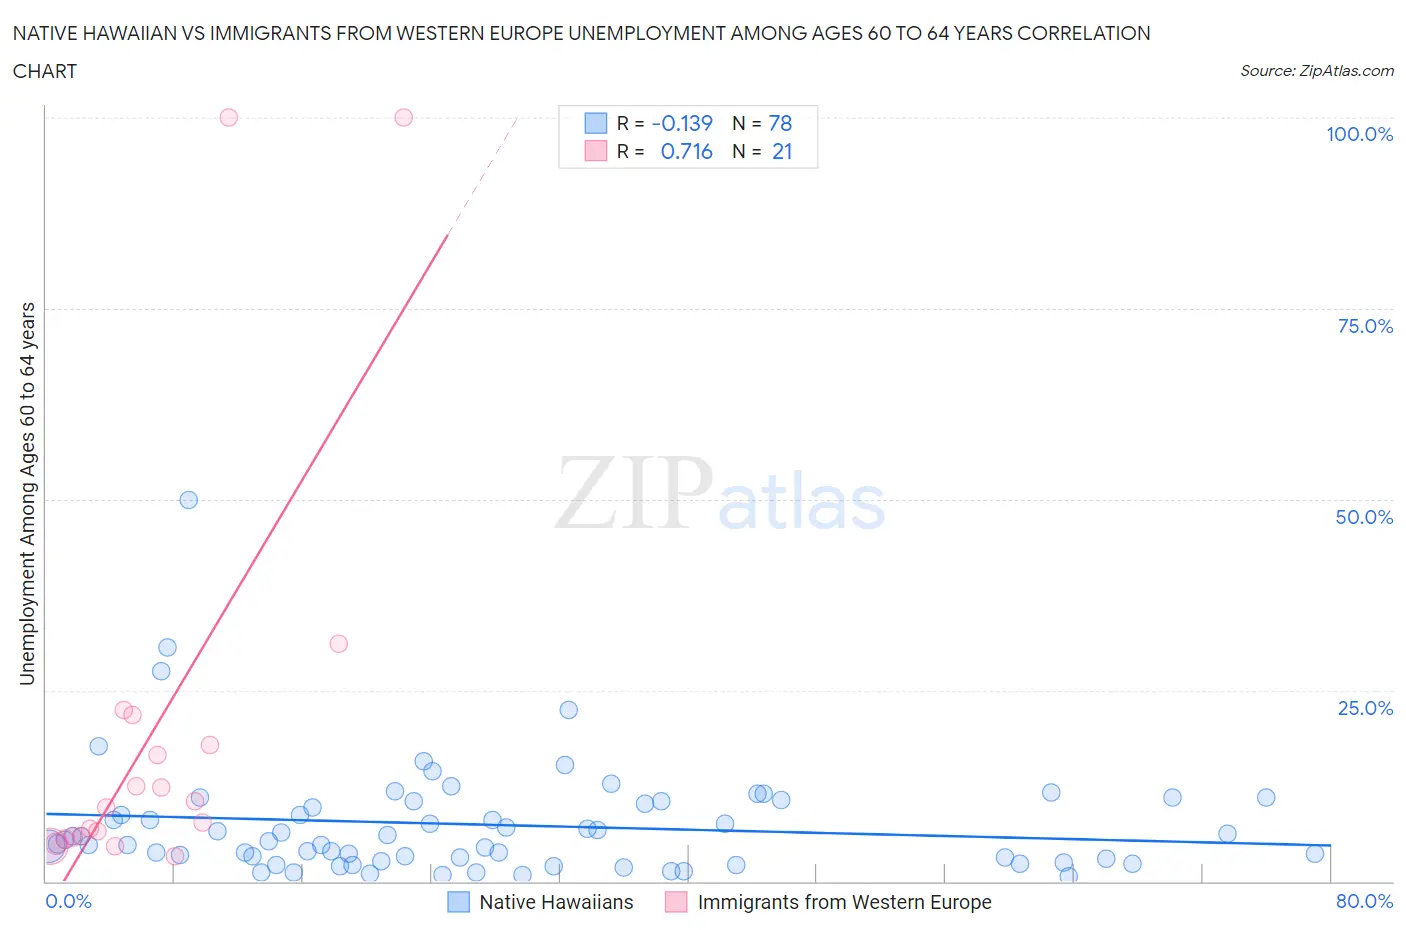
Native Hawaiian vs Immigrants from Western Europe Unemployment Among Ages 60 to 64 years Correlation Chart
The statistical analysis conducted on geographies consisting of 302,694,280 people shows a poor negative correlation between the proportion of Native Hawaiians and unemployment rate among population between the ages 60 and 64 in the United States with a correlation coefficient (R) of -0.139 and weighted average of 4.5%. Similarly, the statistical analysis conducted on geographies consisting of 428,692,856 people shows a strong positive correlation between the proportion of Immigrants from Western Europe and unemployment rate among population between the ages 60 and 64 in the United States with a correlation coefficient (R) of 0.716 and weighted average of 4.9%, a difference of 8.0%.
Unemployment Among Ages 60 to 64 years Correlation Summary
| Measurement | Native Hawaiian | Immigrants from Western Europe |
| Minimum | 0.60% | 3.3% |
| Maximum | 50.0% | 100.0% |
| Range | 49.4% | 96.7% |
| Mean | 7.4% | 19.5% |
| Median | 5.3% | 9.7% |
| Interquartile 25% (IQ1) | 2.9% | 5.7% |
| Interquartile 75% (IQ3) | 10.4% | 19.8% |
| Interquartile Range (IQR) | 7.5% | 14.1% |
| Standard Deviation (Sample) | 7.5% | 27.7% |
| Standard Deviation (Population) | 7.5% | 27.0% |
Similar Demographics by Unemployment Among Ages 60 to 64 years
Demographics Similar to Native Hawaiians by Unemployment Among Ages 60 to 64 years
In terms of unemployment among ages 60 to 64 years, the demographic groups most similar to Native Hawaiians are Iraqi (4.5%, a difference of 0.0%), Scandinavian (4.5%, a difference of 0.15%), Immigrants from Portugal (4.5%, a difference of 0.20%), Venezuelan (4.5%, a difference of 0.23%), and German (4.5%, a difference of 0.24%).
| Demographics | Rating | Rank | Unemployment Among Ages 60 to 64 years |
| Immigrants | Eritrea | 100.0 /100 | #31 | Exceptional 4.5% |
| Zimbabweans | 100.0 /100 | #32 | Exceptional 4.5% |
| Carpatho Rusyns | 100.0 /100 | #33 | Exceptional 4.5% |
| Belgians | 100.0 /100 | #34 | Exceptional 4.5% |
| Germans | 100.0 /100 | #35 | Exceptional 4.5% |
| Venezuelans | 100.0 /100 | #36 | Exceptional 4.5% |
| Immigrants | Portugal | 100.0 /100 | #37 | Exceptional 4.5% |
| Native Hawaiians | 100.0 /100 | #38 | Exceptional 4.5% |
| Iraqis | 100.0 /100 | #39 | Exceptional 4.5% |
| Scandinavians | 100.0 /100 | #40 | Exceptional 4.5% |
| Immigrants | Sudan | 100.0 /100 | #41 | Exceptional 4.5% |
| English | 100.0 /100 | #42 | Exceptional 4.5% |
| Swedes | 100.0 /100 | #43 | Exceptional 4.5% |
| Europeans | 100.0 /100 | #44 | Exceptional 4.5% |
| Liberians | 99.9 /100 | #45 | Exceptional 4.5% |
Demographics Similar to Immigrants from Western Europe by Unemployment Among Ages 60 to 64 years
In terms of unemployment among ages 60 to 64 years, the demographic groups most similar to Immigrants from Western Europe are Immigrants from Hungary (4.9%, a difference of 0.010%), Immigrants from Turkey (4.9%, a difference of 0.10%), Immigrants from Latvia (4.9%, a difference of 0.11%), Bermudan (4.9%, a difference of 0.12%), and Samoan (4.9%, a difference of 0.13%).
| Demographics | Rating | Rank | Unemployment Among Ages 60 to 64 years |
| Immigrants | Northern Europe | 59.1 /100 | #167 | Average 4.8% |
| Immigrants | Southern Europe | 56.7 /100 | #168 | Average 4.8% |
| Immigrants | France | 55.5 /100 | #169 | Average 4.8% |
| Immigrants | Korea | 54.2 /100 | #170 | Average 4.8% |
| Samoans | 53.6 /100 | #171 | Average 4.9% |
| Immigrants | Turkey | 52.8 /100 | #172 | Average 4.9% |
| Immigrants | Hungary | 50.2 /100 | #173 | Average 4.9% |
| Immigrants | Western Europe | 50.0 /100 | #174 | Average 4.9% |
| Immigrants | Latvia | 46.9 /100 | #175 | Average 4.9% |
| Bermudans | 46.5 /100 | #176 | Average 4.9% |
| Immigrants | Malaysia | 44.7 /100 | #177 | Average 4.9% |
| Immigrants | Nonimmigrants | 44.5 /100 | #178 | Average 4.9% |
| Immigrants | Sweden | 44.3 /100 | #179 | Average 4.9% |
| Asians | 40.8 /100 | #180 | Average 4.9% |
| Hungarians | 40.6 /100 | #181 | Average 4.9% |