Immigrants from Southern Europe vs French Male Unemployment
COMPARE
Immigrants from Southern Europe
French
Male Unemployment
Male Unemployment Comparison
Immigrants from Southern Europe
French
5.4%
MALE UNEMPLOYMENT
17.7/ 100
METRIC RATING
195th/ 347
METRIC RANK
5.0%
MALE UNEMPLOYMENT
96.2/ 100
METRIC RATING
81st/ 347
METRIC RANK
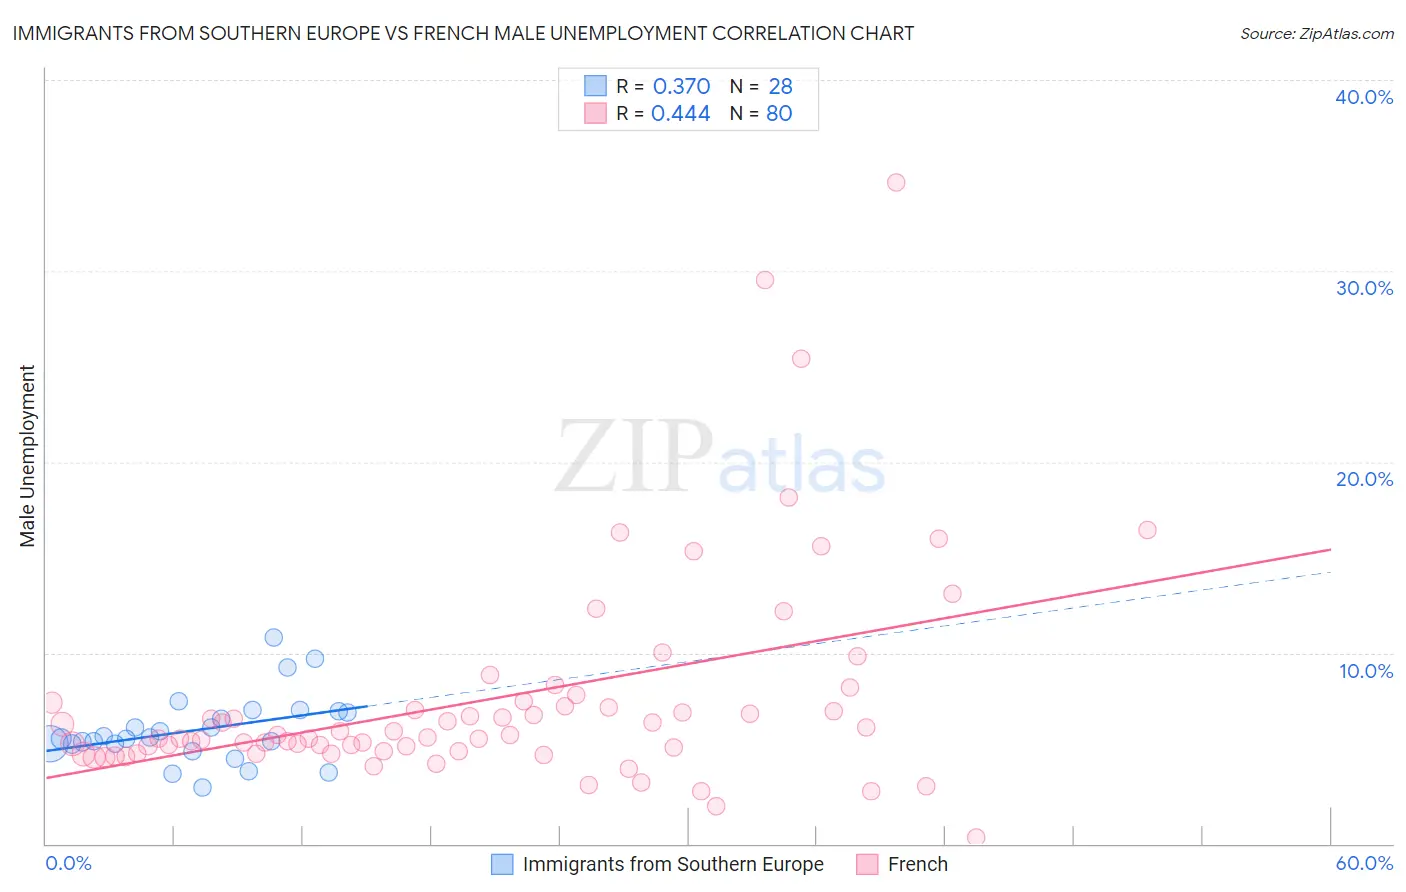
Immigrants from Southern Europe vs French Male Unemployment Correlation Chart
The statistical analysis conducted on geographies consisting of 401,185,353 people shows a mild positive correlation between the proportion of Immigrants from Southern Europe and unemployment rate among males in the United States with a correlation coefficient (R) of 0.370 and weighted average of 5.4%. Similarly, the statistical analysis conducted on geographies consisting of 561,355,143 people shows a moderate positive correlation between the proportion of French and unemployment rate among males in the United States with a correlation coefficient (R) of 0.444 and weighted average of 5.0%, a difference of 7.3%.
Male Unemployment Correlation Summary
| Measurement | Immigrants from Southern Europe | French |
| Minimum | 2.9% | 0.30% |
| Maximum | 10.8% | 34.6% |
| Range | 7.9% | 34.3% |
| Mean | 6.0% | 7.6% |
| Median | 5.5% | 5.6% |
| Interquartile 25% (IQ1) | 5.2% | 4.9% |
| Interquartile 75% (IQ3) | 6.9% | 7.3% |
| Interquartile Range (IQR) | 1.7% | 2.4% |
| Standard Deviation (Sample) | 1.8% | 5.7% |
| Standard Deviation (Population) | 1.7% | 5.6% |
Similar Demographics by Male Unemployment
Demographics Similar to Immigrants from Southern Europe by Male Unemployment
In terms of male unemployment, the demographic groups most similar to Immigrants from Southern Europe are Albanian (5.4%, a difference of 0.040%), Alsatian (5.4%, a difference of 0.10%), Spanish (5.4%, a difference of 0.18%), Immigrants from Thailand (5.4%, a difference of 0.32%), and Immigrants from Greece (5.4%, a difference of 0.34%).
| Demographics | Rating | Rank | Male Unemployment |
| Arabs | 30.2 /100 | #188 | Fair 5.4% |
| Immigrants | South America | 29.4 /100 | #189 | Fair 5.4% |
| Immigrants | Uganda | 28.8 /100 | #190 | Fair 5.4% |
| Immigrants | South Eastern Asia | 28.2 /100 | #191 | Fair 5.4% |
| Immigrants | Belarus | 26.0 /100 | #192 | Fair 5.4% |
| Immigrants | Israel | 25.2 /100 | #193 | Fair 5.4% |
| Spanish | 19.7 /100 | #194 | Poor 5.4% |
| Immigrants | Southern Europe | 17.7 /100 | #195 | Poor 5.4% |
| Albanians | 17.3 /100 | #196 | Poor 5.4% |
| Alsatians | 16.7 /100 | #197 | Poor 5.4% |
| Immigrants | Thailand | 14.7 /100 | #198 | Poor 5.4% |
| Immigrants | Greece | 14.5 /100 | #199 | Poor 5.4% |
| Immigrants | Zaire | 13.7 /100 | #200 | Poor 5.4% |
| Immigrants | Philippines | 13.5 /100 | #201 | Poor 5.4% |
| Immigrants | Nonimmigrants | 13.1 /100 | #202 | Poor 5.4% |
Demographics Similar to French by Male Unemployment
In terms of male unemployment, the demographic groups most similar to French are Argentinean (5.0%, a difference of 0.0%), Chilean (5.0%, a difference of 0.030%), South African (5.0%, a difference of 0.050%), Immigrants from Northern Europe (5.0%, a difference of 0.070%), and Iranian (5.0%, a difference of 0.080%).
| Demographics | Rating | Rank | Male Unemployment |
| Immigrants | North America | 96.9 /100 | #74 | Exceptional 5.0% |
| Assyrians/Chaldeans/Syriacs | 96.9 /100 | #75 | Exceptional 5.0% |
| Immigrants | Sudan | 96.5 /100 | #76 | Exceptional 5.0% |
| Iranians | 96.4 /100 | #77 | Exceptional 5.0% |
| Immigrants | Northern Europe | 96.4 /100 | #78 | Exceptional 5.0% |
| South Africans | 96.4 /100 | #79 | Exceptional 5.0% |
| Argentineans | 96.2 /100 | #80 | Exceptional 5.0% |
| French | 96.2 /100 | #81 | Exceptional 5.0% |
| Chileans | 96.2 /100 | #82 | Exceptional 5.0% |
| Immigrants | Eritrea | 96.0 /100 | #83 | Exceptional 5.0% |
| Serbians | 95.7 /100 | #84 | Exceptional 5.1% |
| Immigrants | North Macedonia | 95.6 /100 | #85 | Exceptional 5.1% |
| Maltese | 95.5 /100 | #86 | Exceptional 5.1% |
| Immigrants | Romania | 95.4 /100 | #87 | Exceptional 5.1% |
| Immigrants | Sri Lanka | 94.9 /100 | #88 | Exceptional 5.1% |