Menominee vs Immigrants from Eastern Asia Unemployment Among Women with Children Under 18 years
COMPARE
Menominee
Immigrants from Eastern Asia
Unemployment Among Women with Children Under 18 years
Unemployment Among Women with Children Under 18 years Comparison
Menominee
Immigrants from Eastern Asia
5.6%
UNEMPLOYMENT AMONG WOMEN WITH CHILDREN UNDER 18 YEARS
18.6/ 100
METRIC RATING
200th/ 347
METRIC RANK
4.9%
UNEMPLOYMENT AMONG WOMEN WITH CHILDREN UNDER 18 YEARS
99.5/ 100
METRIC RATING
28th/ 347
METRIC RANK
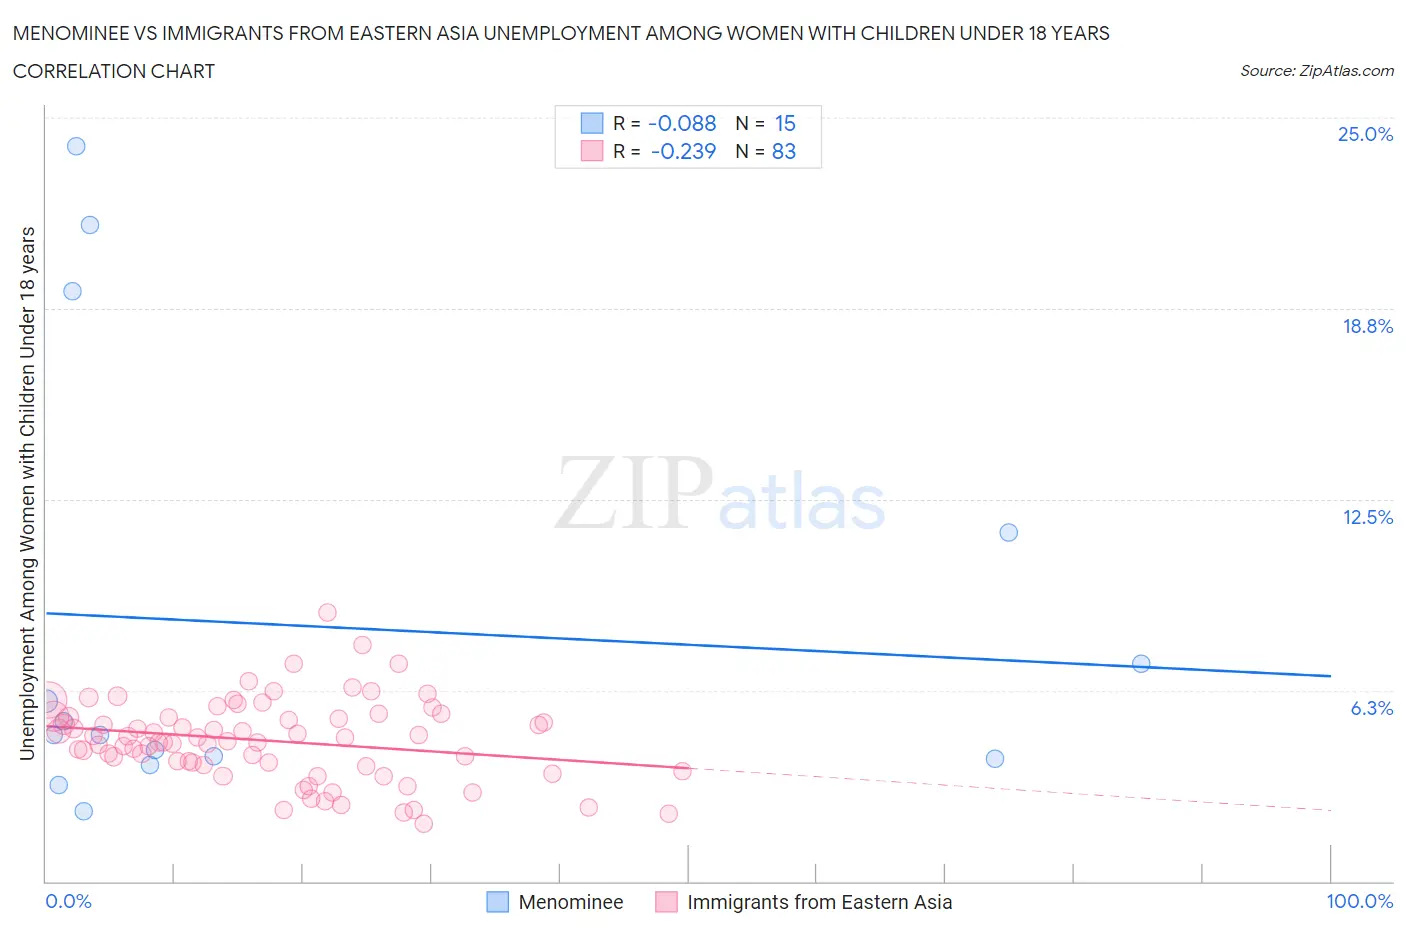
Menominee vs Immigrants from Eastern Asia Unemployment Among Women with Children Under 18 years Correlation Chart
The statistical analysis conducted on geographies consisting of 45,024,855 people shows a slight negative correlation between the proportion of Menominee and unemployment rate among women with children under the age of 18 in the United States with a correlation coefficient (R) of -0.088 and weighted average of 5.6%. Similarly, the statistical analysis conducted on geographies consisting of 470,021,238 people shows a weak negative correlation between the proportion of Immigrants from Eastern Asia and unemployment rate among women with children under the age of 18 in the United States with a correlation coefficient (R) of -0.239 and weighted average of 4.9%, a difference of 13.1%.
Unemployment Among Women with Children Under 18 years Correlation Summary
| Measurement | Menominee | Immigrants from Eastern Asia |
| Minimum | 2.3% | 1.9% |
| Maximum | 24.0% | 8.8% |
| Range | 21.7% | 6.9% |
| Mean | 8.4% | 4.6% |
| Median | 4.8% | 4.6% |
| Interquartile 25% (IQ1) | 4.0% | 3.8% |
| Interquartile 75% (IQ3) | 11.4% | 5.4% |
| Interquartile Range (IQR) | 7.4% | 1.6% |
| Standard Deviation (Sample) | 7.2% | 1.3% |
| Standard Deviation (Population) | 7.0% | 1.3% |
Similar Demographics by Unemployment Among Women with Children Under 18 years
Demographics Similar to Menominee by Unemployment Among Women with Children Under 18 years
In terms of unemployment among women with children under 18 years, the demographic groups most similar to Menominee are Immigrants from Morocco (5.6%, a difference of 0.080%), Marshallese (5.6%, a difference of 0.18%), Immigrants from Micronesia (5.6%, a difference of 0.18%), Immigrants from Colombia (5.6%, a difference of 0.31%), and Arab (5.6%, a difference of 0.31%).
| Demographics | Rating | Rank | Unemployment Among Women with Children Under 18 years |
| Immigrants | Afghanistan | 29.3 /100 | #193 | Fair 5.5% |
| Immigrants | Chile | 29.2 /100 | #194 | Fair 5.5% |
| Colombians | 22.8 /100 | #195 | Fair 5.6% |
| Spaniards | 22.8 /100 | #196 | Fair 5.6% |
| Immigrants | Colombia | 21.4 /100 | #197 | Fair 5.6% |
| Arabs | 21.4 /100 | #198 | Fair 5.6% |
| Marshallese | 20.2 /100 | #199 | Fair 5.6% |
| Menominee | 18.6 /100 | #200 | Poor 5.6% |
| Immigrants | Morocco | 17.9 /100 | #201 | Poor 5.6% |
| Immigrants | Micronesia | 17.1 /100 | #202 | Poor 5.6% |
| Portuguese | 15.9 /100 | #203 | Poor 5.6% |
| Israelis | 15.6 /100 | #204 | Poor 5.6% |
| Tsimshian | 15.2 /100 | #205 | Poor 5.6% |
| Nicaraguans | 12.3 /100 | #206 | Poor 5.6% |
| Peruvians | 12.1 /100 | #207 | Poor 5.6% |
Demographics Similar to Immigrants from Eastern Asia by Unemployment Among Women with Children Under 18 years
In terms of unemployment among women with children under 18 years, the demographic groups most similar to Immigrants from Eastern Asia are Finnish (4.9%, a difference of 0.050%), Burmese (4.9%, a difference of 0.12%), Soviet Union (4.9%, a difference of 0.16%), Swiss (4.9%, a difference of 0.23%), and Chinese (4.9%, a difference of 0.34%).
| Demographics | Rating | Rank | Unemployment Among Women with Children Under 18 years |
| Europeans | 99.6 /100 | #21 | Exceptional 4.9% |
| Indians (Asian) | 99.6 /100 | #22 | Exceptional 4.9% |
| Immigrants | China | 99.6 /100 | #23 | Exceptional 4.9% |
| Belgians | 99.5 /100 | #24 | Exceptional 4.9% |
| Chinese | 99.5 /100 | #25 | Exceptional 4.9% |
| Swiss | 99.5 /100 | #26 | Exceptional 4.9% |
| Soviet Union | 99.5 /100 | #27 | Exceptional 4.9% |
| Immigrants | Eastern Asia | 99.5 /100 | #28 | Exceptional 4.9% |
| Finns | 99.4 /100 | #29 | Exceptional 4.9% |
| Burmese | 99.4 /100 | #30 | Exceptional 4.9% |
| Cypriots | 99.3 /100 | #31 | Exceptional 5.0% |
| Dutch | 99.3 /100 | #32 | Exceptional 5.0% |
| Croatians | 99.3 /100 | #33 | Exceptional 5.0% |
| Immigrants | South Central Asia | 99.2 /100 | #34 | Exceptional 5.0% |
| Luxembourgers | 99.2 /100 | #35 | Exceptional 5.0% |