Menominee vs Immigrants from Lebanon Unemployment Among Ages 16 to 19 years
COMPARE
Menominee
Immigrants from Lebanon
Unemployment Among Ages 16 to 19 years
Unemployment Among Ages 16 to 19 years Comparison
Menominee
Immigrants from Lebanon
16.6%
UNEMPLOYMENT AMONG AGES 16 TO 19 YEARS
99.3/ 100
METRIC RATING
60th/ 347
METRIC RANK
16.3%
UNEMPLOYMENT AMONG AGES 16 TO 19 YEARS
99.8/ 100
METRIC RATING
43rd/ 347
METRIC RANK
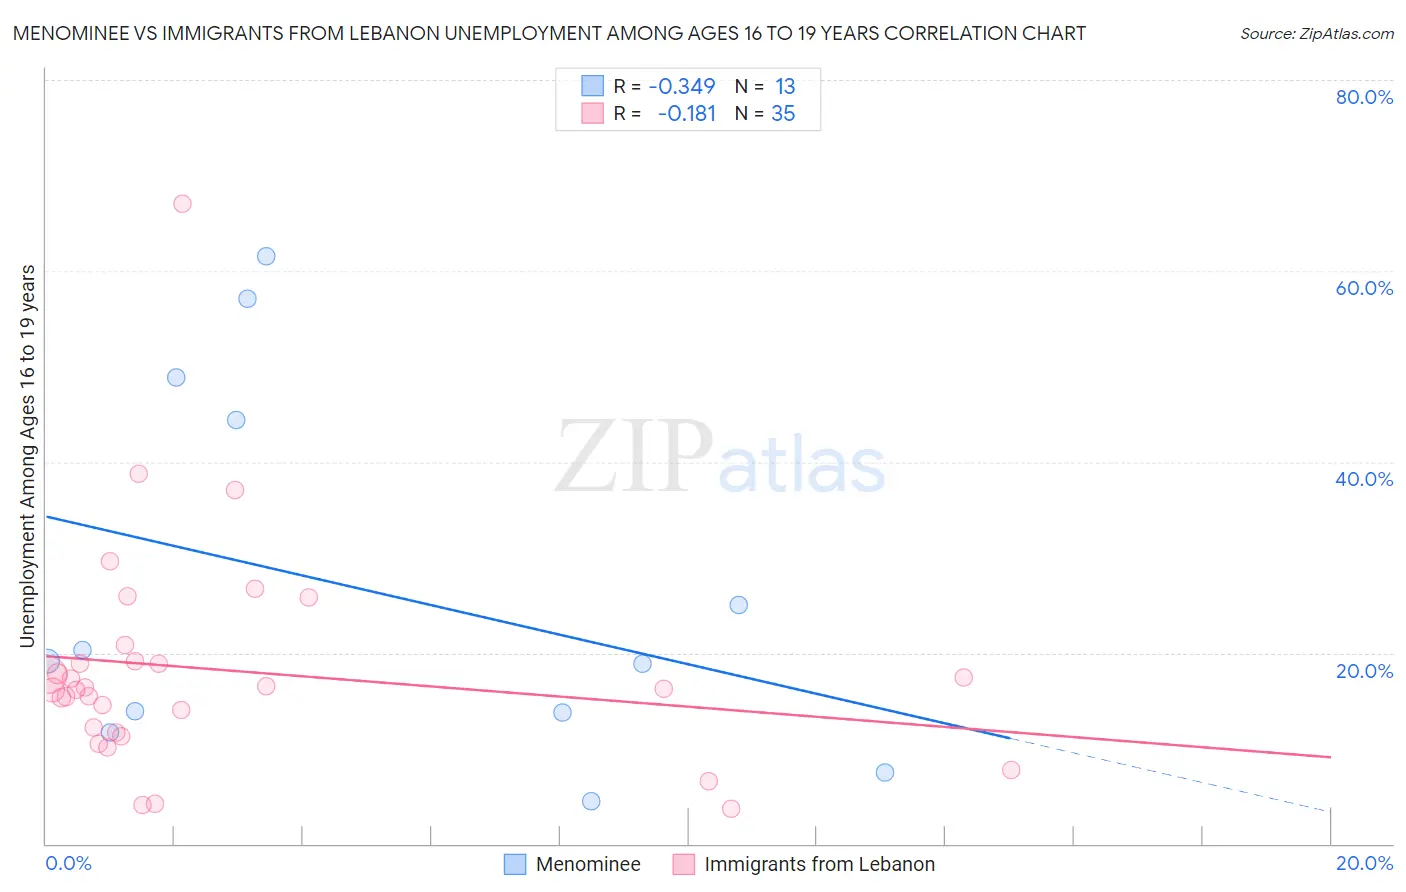
Menominee vs Immigrants from Lebanon Unemployment Among Ages 16 to 19 years Correlation Chart
The statistical analysis conducted on geographies consisting of 45,021,333 people shows a mild negative correlation between the proportion of Menominee and unemployment rate among population between the ages 16 and 19 in the United States with a correlation coefficient (R) of -0.349 and weighted average of 16.6%. Similarly, the statistical analysis conducted on geographies consisting of 210,748,675 people shows a poor negative correlation between the proportion of Immigrants from Lebanon and unemployment rate among population between the ages 16 and 19 in the United States with a correlation coefficient (R) of -0.181 and weighted average of 16.3%, a difference of 1.4%.
Unemployment Among Ages 16 to 19 years Correlation Summary
| Measurement | Menominee | Immigrants from Lebanon |
| Minimum | 4.4% | 3.7% |
| Maximum | 61.5% | 67.0% |
| Range | 57.1% | 63.3% |
| Mean | 26.6% | 18.2% |
| Median | 19.2% | 16.2% |
| Interquartile 25% (IQ1) | 12.7% | 11.7% |
| Interquartile 75% (IQ3) | 46.6% | 19.1% |
| Interquartile Range (IQR) | 33.9% | 7.4% |
| Standard Deviation (Sample) | 19.4% | 11.7% |
| Standard Deviation (Population) | 18.7% | 11.6% |
Demographics Similar to Menominee and Immigrants from Lebanon by Unemployment Among Ages 16 to 19 years
In terms of unemployment among ages 16 to 19 years, the demographic groups most similar to Menominee are Immigrants from Cuba (16.6%, a difference of 0.060%), Irish (16.5%, a difference of 0.17%), Immigrants from Uganda (16.5%, a difference of 0.22%), Immigrants from Jordan (16.5%, a difference of 0.27%), and Sri Lankan (16.5%, a difference of 0.55%). Similarly, the demographic groups most similar to Immigrants from Lebanon are Fijian (16.3%, a difference of 0.070%), Immigrants from Nepal (16.3%, a difference of 0.10%), Immigrants from Zimbabwe (16.3%, a difference of 0.13%), Polish (16.4%, a difference of 0.14%), and Immigrants from North Macedonia (16.4%, a difference of 0.16%).
| Demographics | Rating | Rank | Unemployment Among Ages 16 to 19 years |
| Immigrants | Nepal | 99.8 /100 | #41 | Exceptional 16.3% |
| Fijians | 99.8 /100 | #42 | Exceptional 16.3% |
| Immigrants | Lebanon | 99.8 /100 | #43 | Exceptional 16.3% |
| Immigrants | Zimbabwe | 99.7 /100 | #44 | Exceptional 16.3% |
| Poles | 99.7 /100 | #45 | Exceptional 16.4% |
| Immigrants | North Macedonia | 99.7 /100 | #46 | Exceptional 16.4% |
| Immigrants | Vietnam | 99.7 /100 | #47 | Exceptional 16.4% |
| Maltese | 99.7 /100 | #48 | Exceptional 16.4% |
| Iraqis | 99.7 /100 | #49 | Exceptional 16.4% |
| Bhutanese | 99.6 /100 | #50 | Exceptional 16.4% |
| Lebanese | 99.6 /100 | #51 | Exceptional 16.4% |
| Welsh | 99.6 /100 | #52 | Exceptional 16.4% |
| Slovenes | 99.6 /100 | #53 | Exceptional 16.4% |
| British | 99.5 /100 | #54 | Exceptional 16.5% |
| Czechoslovakians | 99.5 /100 | #55 | Exceptional 16.5% |
| Sri Lankans | 99.5 /100 | #56 | Exceptional 16.5% |
| Immigrants | Jordan | 99.4 /100 | #57 | Exceptional 16.5% |
| Immigrants | Uganda | 99.4 /100 | #58 | Exceptional 16.5% |
| Irish | 99.4 /100 | #59 | Exceptional 16.5% |
| Menominee | 99.3 /100 | #60 | Exceptional 16.6% |
| Immigrants | Cuba | 99.2 /100 | #61 | Exceptional 16.6% |