Austrian vs Samoan Unemployment Among Seniors over 75 years
COMPARE
Austrian
Samoan
Unemployment Among Seniors over 75 years
Unemployment Among Seniors over 75 years Comparison
Austrians
Samoans
9.3%
UNEMPLOYMENT AMONG SENIORS OVER 75 YEARS
0.7/ 100
METRIC RATING
262nd/ 347
METRIC RANK
9.1%
UNEMPLOYMENT AMONG SENIORS OVER 75 YEARS
5.7/ 100
METRIC RATING
227th/ 347
METRIC RANK
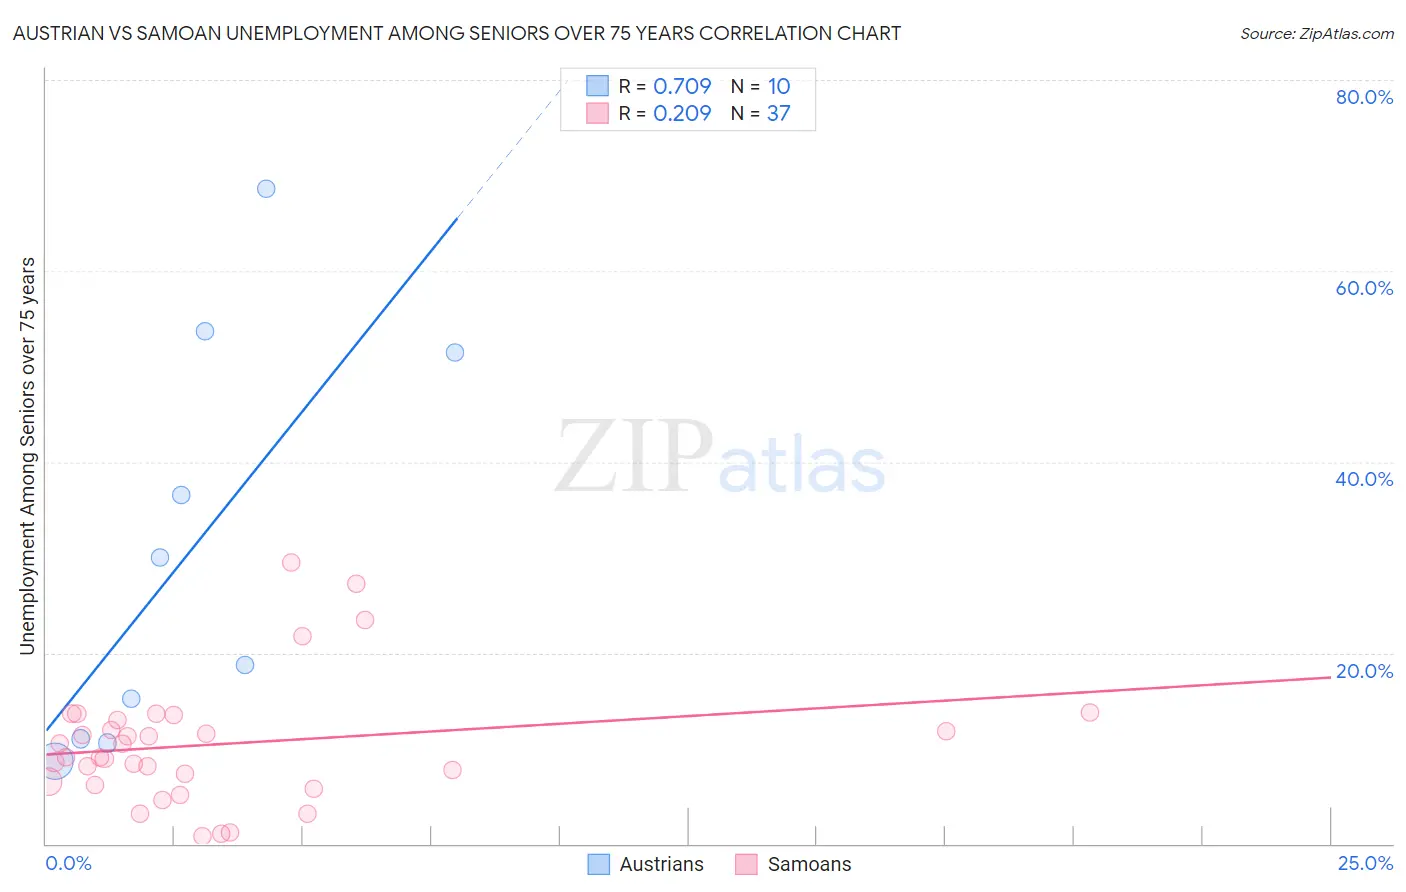
Austrian vs Samoan Unemployment Among Seniors over 75 years Correlation Chart
The statistical analysis conducted on geographies consisting of 215,407,440 people shows a strong positive correlation between the proportion of Austrians and unemployment rate among seniors over the age of 75 in the United States with a correlation coefficient (R) of 0.709 and weighted average of 9.3%. Similarly, the statistical analysis conducted on geographies consisting of 137,123,873 people shows a weak positive correlation between the proportion of Samoans and unemployment rate among seniors over the age of 75 in the United States with a correlation coefficient (R) of 0.209 and weighted average of 9.1%, a difference of 2.7%.
Unemployment Among Seniors over 75 years Correlation Summary
| Measurement | Austrian | Samoan |
| Minimum | 8.6% | 0.80% |
| Maximum | 68.6% | 29.4% |
| Range | 60.0% | 28.6% |
| Mean | 30.4% | 10.4% |
| Median | 24.4% | 9.1% |
| Interquartile 25% (IQ1) | 11.0% | 6.3% |
| Interquartile 75% (IQ3) | 51.4% | 13.2% |
| Interquartile Range (IQR) | 40.4% | 6.9% |
| Standard Deviation (Sample) | 21.3% | 6.5% |
| Standard Deviation (Population) | 20.2% | 6.5% |
Similar Demographics by Unemployment Among Seniors over 75 years
Demographics Similar to Austrians by Unemployment Among Seniors over 75 years
In terms of unemployment among seniors over 75 years, the demographic groups most similar to Austrians are Celtic (9.3%, a difference of 0.10%), Ukrainian (9.3%, a difference of 0.12%), Iroquois (9.3%, a difference of 0.13%), Palestinian (9.3%, a difference of 0.25%), and Immigrants from Cameroon (9.3%, a difference of 0.37%).
| Demographics | Rating | Rank | Unemployment Among Seniors over 75 years |
| Immigrants | Scotland | 1.4 /100 | #255 | Tragic 9.2% |
| Brazilians | 1.3 /100 | #256 | Tragic 9.3% |
| Hawaiians | 1.2 /100 | #257 | Tragic 9.3% |
| Immigrants | England | 1.0 /100 | #258 | Tragic 9.3% |
| Slovenes | 1.0 /100 | #259 | Tragic 9.3% |
| Immigrants | Cameroon | 1.0 /100 | #260 | Tragic 9.3% |
| Celtics | 0.8 /100 | #261 | Tragic 9.3% |
| Austrians | 0.7 /100 | #262 | Tragic 9.3% |
| Ukrainians | 0.7 /100 | #263 | Tragic 9.3% |
| Iroquois | 0.7 /100 | #264 | Tragic 9.3% |
| Palestinians | 0.6 /100 | #265 | Tragic 9.3% |
| Blacks/African Americans | 0.5 /100 | #266 | Tragic 9.4% |
| Immigrants | Mexico | 0.4 /100 | #267 | Tragic 9.4% |
| Greeks | 0.4 /100 | #268 | Tragic 9.4% |
| Puerto Ricans | 0.3 /100 | #269 | Tragic 9.4% |
Demographics Similar to Samoans by Unemployment Among Seniors over 75 years
In terms of unemployment among seniors over 75 years, the demographic groups most similar to Samoans are Immigrants from Bangladesh (9.1%, a difference of 0.050%), Kenyan (9.1%, a difference of 0.060%), Navajo (9.1%, a difference of 0.10%), Costa Rican (9.1%, a difference of 0.14%), and Hispanic or Latino (9.1%, a difference of 0.18%).
| Demographics | Rating | Rank | Unemployment Among Seniors over 75 years |
| Immigrants | Zimbabwe | 7.8 /100 | #220 | Tragic 9.0% |
| Guamanians/Chamorros | 7.7 /100 | #221 | Tragic 9.0% |
| Peruvians | 7.3 /100 | #222 | Tragic 9.0% |
| Immigrants | Jordan | 6.9 /100 | #223 | Tragic 9.0% |
| Costa Ricans | 6.3 /100 | #224 | Tragic 9.1% |
| Navajo | 6.1 /100 | #225 | Tragic 9.1% |
| Immigrants | Bangladesh | 5.9 /100 | #226 | Tragic 9.1% |
| Samoans | 5.7 /100 | #227 | Tragic 9.1% |
| Kenyans | 5.4 /100 | #228 | Tragic 9.1% |
| Hispanics or Latinos | 5.0 /100 | #229 | Tragic 9.1% |
| Northern Europeans | 4.9 /100 | #230 | Tragic 9.1% |
| Immigrants | Central America | 4.9 /100 | #231 | Tragic 9.1% |
| Africans | 4.9 /100 | #232 | Tragic 9.1% |
| Yugoslavians | 4.8 /100 | #233 | Tragic 9.1% |
| Vietnamese | 4.6 /100 | #234 | Tragic 9.1% |