Macedonian vs Albanian Unemployment Among Women with Children Under 18 years
COMPARE
Macedonian
Albanian
Unemployment Among Women with Children Under 18 years
Unemployment Among Women with Children Under 18 years Comparison
Macedonians
Albanians
5.3%
UNEMPLOYMENT AMONG WOMEN WITH CHILDREN UNDER 18 YEARS
87.7/ 100
METRIC RATING
116th/ 347
METRIC RANK
5.1%
UNEMPLOYMENT AMONG WOMEN WITH CHILDREN UNDER 18 YEARS
95.9/ 100
METRIC RATING
73rd/ 347
METRIC RANK
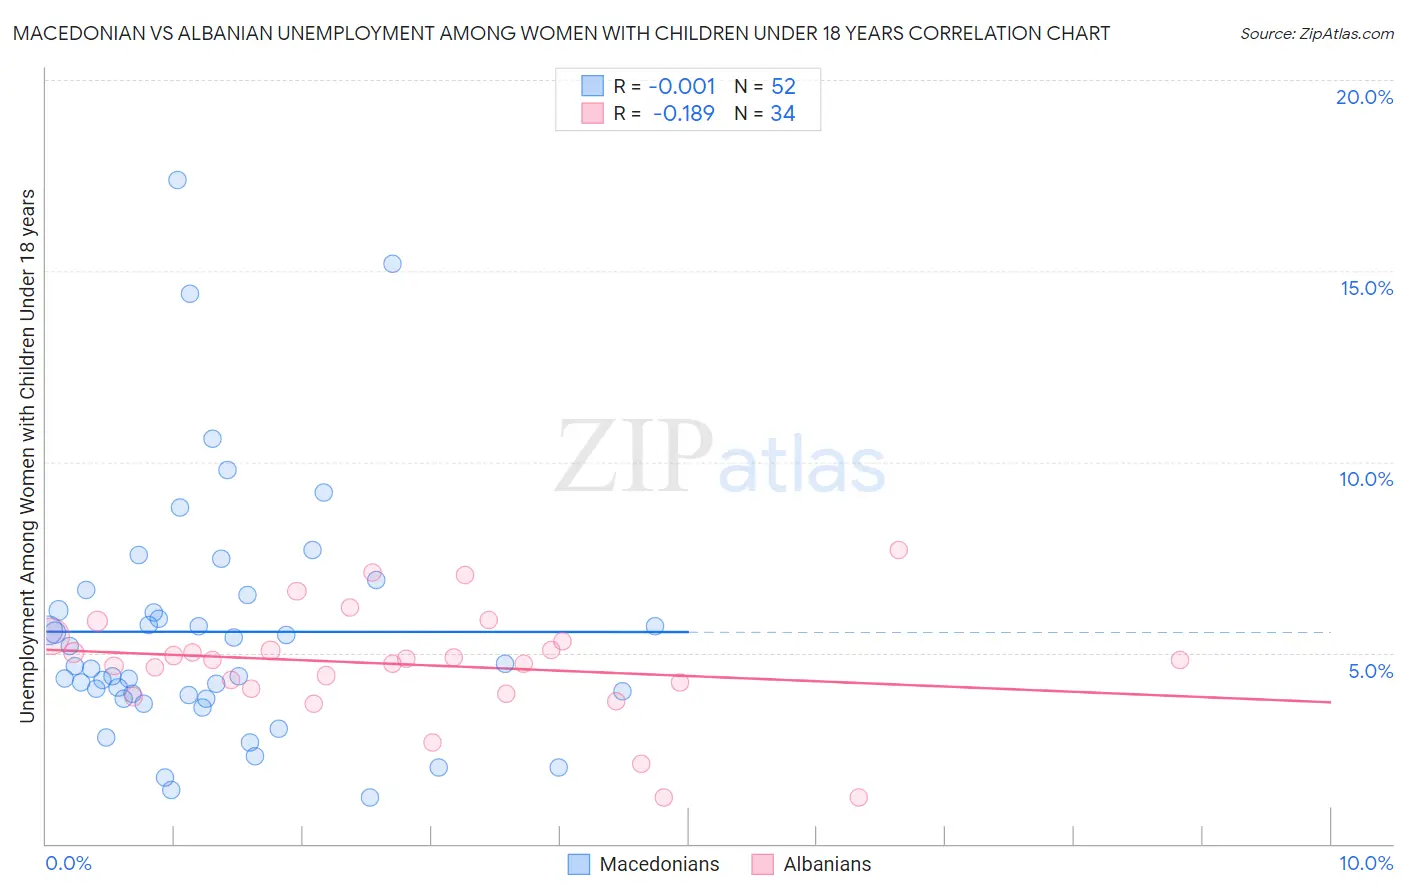
Macedonian vs Albanian Unemployment Among Women with Children Under 18 years Correlation Chart
The statistical analysis conducted on geographies consisting of 130,061,187 people shows no correlation between the proportion of Macedonians and unemployment rate among women with children under the age of 18 in the United States with a correlation coefficient (R) of -0.001 and weighted average of 5.3%. Similarly, the statistical analysis conducted on geographies consisting of 188,327,810 people shows a poor negative correlation between the proportion of Albanians and unemployment rate among women with children under the age of 18 in the United States with a correlation coefficient (R) of -0.189 and weighted average of 5.1%, a difference of 2.2%.
Unemployment Among Women with Children Under 18 years Correlation Summary
| Measurement | Macedonian | Albanian |
| Minimum | 1.2% | 1.2% |
| Maximum | 17.4% | 7.7% |
| Range | 16.2% | 6.5% |
| Mean | 5.5% | 4.7% |
| Median | 4.6% | 4.8% |
| Interquartile 25% (IQ1) | 3.9% | 4.1% |
| Interquartile 75% (IQ3) | 6.3% | 5.3% |
| Interquartile Range (IQR) | 2.4% | 1.2% |
| Standard Deviation (Sample) | 3.3% | 1.5% |
| Standard Deviation (Population) | 3.2% | 1.4% |
Similar Demographics by Unemployment Among Women with Children Under 18 years
Demographics Similar to Macedonians by Unemployment Among Women with Children Under 18 years
In terms of unemployment among women with children under 18 years, the demographic groups most similar to Macedonians are Canadian (5.3%, a difference of 0.060%), Hungarian (5.3%, a difference of 0.070%), Kenyan (5.3%, a difference of 0.080%), French (5.2%, a difference of 0.12%), and Immigrants from Eastern Europe (5.2%, a difference of 0.14%).
| Demographics | Rating | Rank | Unemployment Among Women with Children Under 18 years |
| Immigrants | Russia | 89.0 /100 | #109 | Excellent 5.2% |
| Immigrants | Czechoslovakia | 88.9 /100 | #110 | Excellent 5.2% |
| French Canadians | 88.9 /100 | #111 | Excellent 5.2% |
| Immigrants | Eastern Europe | 88.5 /100 | #112 | Excellent 5.2% |
| French | 88.4 /100 | #113 | Excellent 5.2% |
| Kenyans | 88.2 /100 | #114 | Excellent 5.3% |
| Hungarians | 88.1 /100 | #115 | Excellent 5.3% |
| Macedonians | 87.7 /100 | #116 | Excellent 5.3% |
| Canadians | 87.4 /100 | #117 | Excellent 5.3% |
| Immigrants | Europe | 86.7 /100 | #118 | Excellent 5.3% |
| Basques | 86.5 /100 | #119 | Excellent 5.3% |
| Egyptians | 86.4 /100 | #120 | Excellent 5.3% |
| Immigrants | Romania | 85.8 /100 | #121 | Excellent 5.3% |
| Scotch-Irish | 85.7 /100 | #122 | Excellent 5.3% |
| Sudanese | 84.3 /100 | #123 | Excellent 5.3% |
Demographics Similar to Albanians by Unemployment Among Women with Children Under 18 years
In terms of unemployment among women with children under 18 years, the demographic groups most similar to Albanians are Immigrants from Northern Europe (5.1%, a difference of 0.010%), Immigrants from Asia (5.1%, a difference of 0.040%), Immigrants from Bolivia (5.1%, a difference of 0.070%), Puget Sound Salish (5.1%, a difference of 0.070%), and Zimbabwean (5.1%, a difference of 0.090%).
| Demographics | Rating | Rank | Unemployment Among Women with Children Under 18 years |
| Immigrants | Australia | 97.0 /100 | #66 | Exceptional 5.1% |
| Fijians | 96.9 /100 | #67 | Exceptional 5.1% |
| Irish | 96.8 /100 | #68 | Exceptional 5.1% |
| Austrians | 96.6 /100 | #69 | Exceptional 5.1% |
| Icelanders | 96.6 /100 | #70 | Exceptional 5.1% |
| Serbians | 96.5 /100 | #71 | Exceptional 5.1% |
| Immigrants | Bolivia | 96.1 /100 | #72 | Exceptional 5.1% |
| Albanians | 95.9 /100 | #73 | Exceptional 5.1% |
| Immigrants | Northern Europe | 95.9 /100 | #74 | Exceptional 5.1% |
| Immigrants | Asia | 95.8 /100 | #75 | Exceptional 5.1% |
| Puget Sound Salish | 95.8 /100 | #76 | Exceptional 5.1% |
| Zimbabweans | 95.7 /100 | #77 | Exceptional 5.1% |
| Assyrians/Chaldeans/Syriacs | 95.7 /100 | #78 | Exceptional 5.1% |
| Immigrants | Croatia | 95.6 /100 | #79 | Exceptional 5.1% |
| Bolivians | 95.5 /100 | #80 | Exceptional 5.1% |