Immigrants from Pakistan vs Albanian Unemployment Among Women with Children Under 18 years
COMPARE
Immigrants from Pakistan
Albanian
Unemployment Among Women with Children Under 18 years
Unemployment Among Women with Children Under 18 years Comparison
Immigrants from Pakistan
Albanians
5.2%
UNEMPLOYMENT AMONG WOMEN WITH CHILDREN UNDER 18 YEARS
93.3/ 100
METRIC RATING
92nd/ 347
METRIC RANK
5.1%
UNEMPLOYMENT AMONG WOMEN WITH CHILDREN UNDER 18 YEARS
95.9/ 100
METRIC RATING
73rd/ 347
METRIC RANK
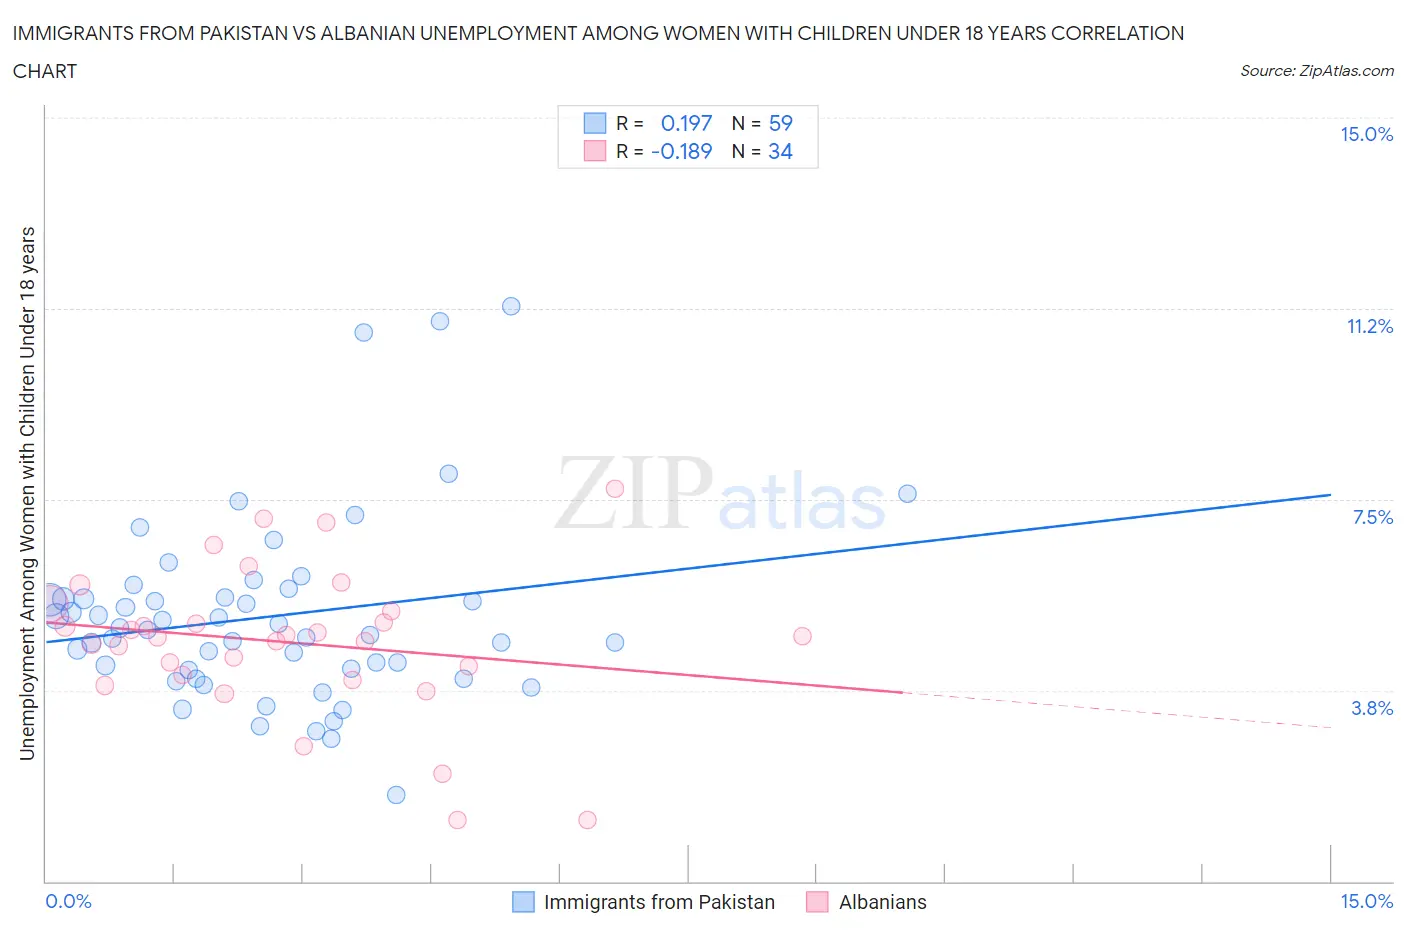
Immigrants from Pakistan vs Albanian Unemployment Among Women with Children Under 18 years Correlation Chart
The statistical analysis conducted on geographies consisting of 277,822,534 people shows a poor positive correlation between the proportion of Immigrants from Pakistan and unemployment rate among women with children under the age of 18 in the United States with a correlation coefficient (R) of 0.197 and weighted average of 5.2%. Similarly, the statistical analysis conducted on geographies consisting of 188,327,810 people shows a poor negative correlation between the proportion of Albanians and unemployment rate among women with children under the age of 18 in the United States with a correlation coefficient (R) of -0.189 and weighted average of 5.1%, a difference of 0.98%.
Unemployment Among Women with Children Under 18 years Correlation Summary
| Measurement | Immigrants from Pakistan | Albanian |
| Minimum | 1.7% | 1.2% |
| Maximum | 11.3% | 7.7% |
| Range | 9.6% | 6.5% |
| Mean | 5.2% | 4.7% |
| Median | 4.9% | 4.8% |
| Interquartile 25% (IQ1) | 4.2% | 4.1% |
| Interquartile 75% (IQ3) | 5.6% | 5.3% |
| Interquartile Range (IQR) | 1.4% | 1.2% |
| Standard Deviation (Sample) | 1.8% | 1.5% |
| Standard Deviation (Population) | 1.8% | 1.4% |
Demographics Similar to Immigrants from Pakistan and Albanians by Unemployment Among Women with Children Under 18 years
In terms of unemployment among women with children under 18 years, the demographic groups most similar to Immigrants from Pakistan are Immigrants from Zimbabwe (5.2%, a difference of 0.080%), Ukrainian (5.2%, a difference of 0.16%), Immigrants from Turkey (5.2%, a difference of 0.29%), Immigrants from Scotland (5.2%, a difference of 0.39%), and Laotian (5.2%, a difference of 0.46%). Similarly, the demographic groups most similar to Albanians are Immigrants from Northern Europe (5.1%, a difference of 0.010%), Immigrants from Asia (5.1%, a difference of 0.040%), Immigrants from Bolivia (5.1%, a difference of 0.070%), Puget Sound Salish (5.1%, a difference of 0.070%), and Zimbabwean (5.1%, a difference of 0.090%).
| Demographics | Rating | Rank | Unemployment Among Women with Children Under 18 years |
| Immigrants | Bolivia | 96.1 /100 | #72 | Exceptional 5.1% |
| Albanians | 95.9 /100 | #73 | Exceptional 5.1% |
| Immigrants | Northern Europe | 95.9 /100 | #74 | Exceptional 5.1% |
| Immigrants | Asia | 95.8 /100 | #75 | Exceptional 5.1% |
| Puget Sound Salish | 95.8 /100 | #76 | Exceptional 5.1% |
| Zimbabweans | 95.7 /100 | #77 | Exceptional 5.1% |
| Assyrians/Chaldeans/Syriacs | 95.7 /100 | #78 | Exceptional 5.1% |
| Immigrants | Croatia | 95.6 /100 | #79 | Exceptional 5.1% |
| Bolivians | 95.5 /100 | #80 | Exceptional 5.1% |
| Immigrants | Lithuania | 95.4 /100 | #81 | Exceptional 5.2% |
| Romanians | 95.3 /100 | #82 | Exceptional 5.2% |
| Maltese | 95.1 /100 | #83 | Exceptional 5.2% |
| Australians | 95.1 /100 | #84 | Exceptional 5.2% |
| Paraguayans | 94.8 /100 | #85 | Exceptional 5.2% |
| Immigrants | Indonesia | 94.8 /100 | #86 | Exceptional 5.2% |
| Laotians | 94.7 /100 | #87 | Exceptional 5.2% |
| Immigrants | Scotland | 94.5 /100 | #88 | Exceptional 5.2% |
| Immigrants | Turkey | 94.2 /100 | #89 | Exceptional 5.2% |
| Ukrainians | 93.8 /100 | #90 | Exceptional 5.2% |
| Immigrants | Zimbabwe | 93.6 /100 | #91 | Exceptional 5.2% |
| Immigrants | Pakistan | 93.3 /100 | #92 | Exceptional 5.2% |