Lumbee vs Immigrants from St. Vincent and the Grenadines Unemployment Among Ages 65 to 74 years
COMPARE
Lumbee
Immigrants from St. Vincent and the Grenadines
Unemployment Among Ages 65 to 74 years
Unemployment Among Ages 65 to 74 years Comparison
Lumbee
Immigrants from St. Vincent and the Grenadines
4.8%
UNEMPLOYMENT AMONG AGES 65 TO 74 YEARS
100.0/ 100
METRIC RATING
13th/ 347
METRIC RANK
5.6%
UNEMPLOYMENT AMONG AGES 65 TO 74 YEARS
0.2/ 100
METRIC RATING
262nd/ 347
METRIC RANK
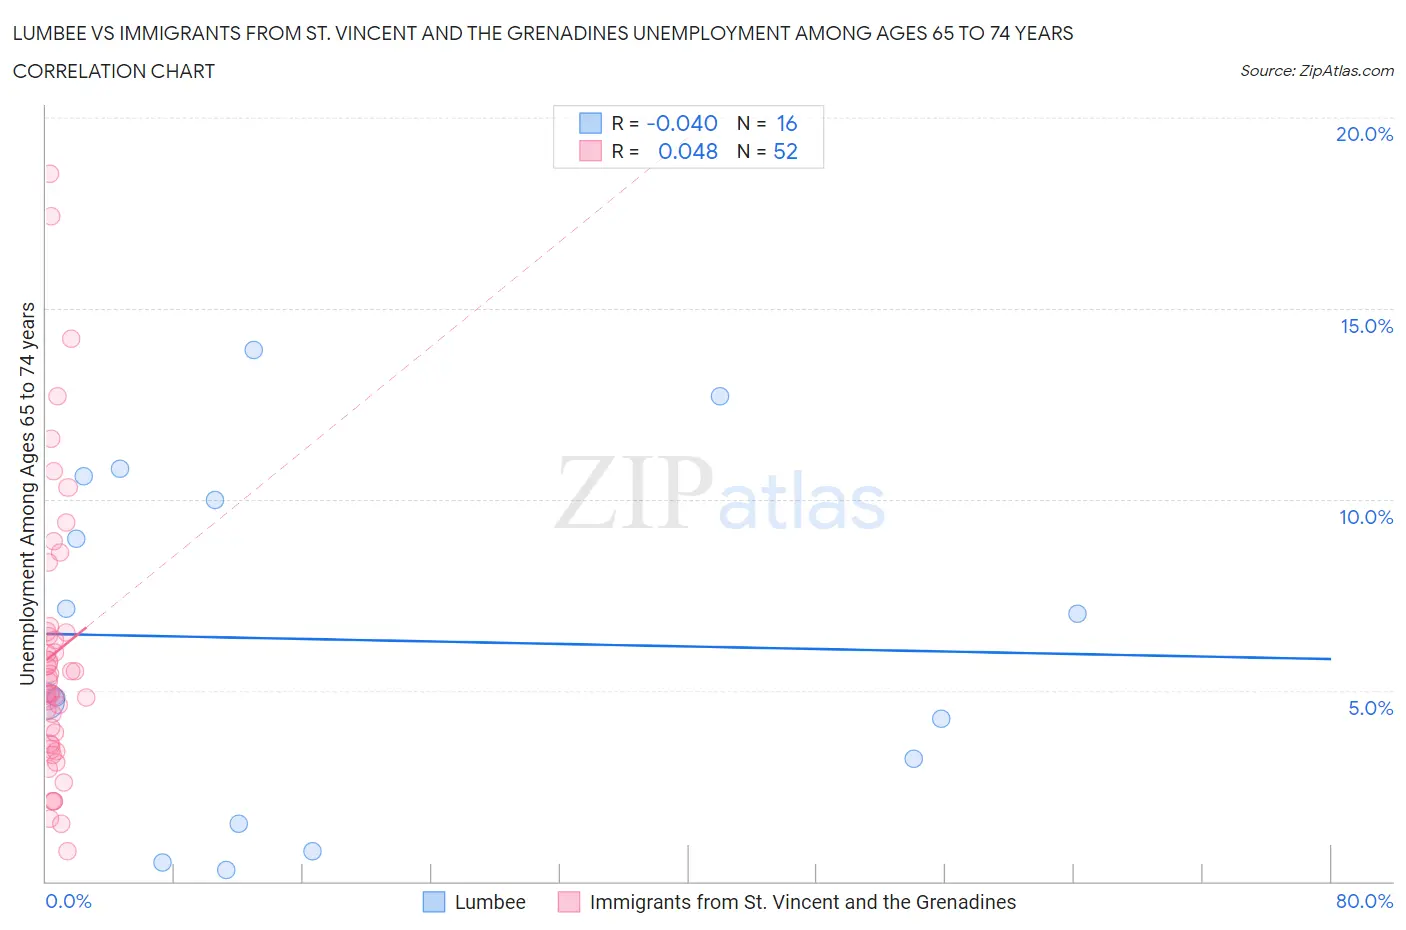
Lumbee vs Immigrants from St. Vincent and the Grenadines Unemployment Among Ages 65 to 74 years Correlation Chart
The statistical analysis conducted on geographies consisting of 85,752,030 people shows no correlation between the proportion of Lumbee and unemployment rate among population between the ages 65 and 74 in the United States with a correlation coefficient (R) of -0.040 and weighted average of 4.8%. Similarly, the statistical analysis conducted on geographies consisting of 54,487,393 people shows no correlation between the proportion of Immigrants from St. Vincent and the Grenadines and unemployment rate among population between the ages 65 and 74 in the United States with a correlation coefficient (R) of 0.048 and weighted average of 5.6%, a difference of 18.7%.
Unemployment Among Ages 65 to 74 years Correlation Summary
| Measurement | Lumbee | Immigrants from St. Vincent and the Grenadines |
| Minimum | 0.30% | 0.80% |
| Maximum | 13.9% | 18.5% |
| Range | 13.6% | 17.7% |
| Mean | 6.3% | 6.0% |
| Median | 5.9% | 5.1% |
| Interquartile 25% (IQ1) | 2.4% | 3.6% |
| Interquartile 75% (IQ3) | 10.3% | 6.5% |
| Interquartile Range (IQR) | 7.9% | 2.9% |
| Standard Deviation (Sample) | 4.5% | 3.7% |
| Standard Deviation (Population) | 4.3% | 3.7% |
Similar Demographics by Unemployment Among Ages 65 to 74 years
Demographics Similar to Lumbee by Unemployment Among Ages 65 to 74 years
In terms of unemployment among ages 65 to 74 years, the demographic groups most similar to Lumbee are Tongan (4.7%, a difference of 0.18%), Cuban (4.8%, a difference of 0.28%), Immigrants from Congo (4.7%, a difference of 0.34%), Osage (4.7%, a difference of 0.75%), and Chickasaw (4.7%, a difference of 0.87%).
| Demographics | Rating | Rank | Unemployment Among Ages 65 to 74 years |
| Immigrants | Cuba | 100.0 /100 | #6 | Exceptional 4.6% |
| Indonesians | 100.0 /100 | #7 | Exceptional 4.7% |
| Comanche | 100.0 /100 | #8 | Exceptional 4.7% |
| Chickasaw | 100.0 /100 | #9 | Exceptional 4.7% |
| Osage | 100.0 /100 | #10 | Exceptional 4.7% |
| Immigrants | Congo | 100.0 /100 | #11 | Exceptional 4.7% |
| Tongans | 100.0 /100 | #12 | Exceptional 4.7% |
| Lumbee | 100.0 /100 | #13 | Exceptional 4.8% |
| Cubans | 100.0 /100 | #14 | Exceptional 4.8% |
| Immigrants | North Macedonia | 100.0 /100 | #15 | Exceptional 4.8% |
| Immigrants | Burma/Myanmar | 100.0 /100 | #16 | Exceptional 4.8% |
| Kenyans | 100.0 /100 | #17 | Exceptional 4.8% |
| Creek | 100.0 /100 | #18 | Exceptional 4.8% |
| Menominee | 100.0 /100 | #19 | Exceptional 4.8% |
| Immigrants | Zaire | 100.0 /100 | #20 | Exceptional 4.8% |
Demographics Similar to Immigrants from St. Vincent and the Grenadines by Unemployment Among Ages 65 to 74 years
In terms of unemployment among ages 65 to 74 years, the demographic groups most similar to Immigrants from St. Vincent and the Grenadines are Immigrants from Jamaica (5.6%, a difference of 0.010%), Pueblo (5.6%, a difference of 0.020%), South American (5.6%, a difference of 0.050%), Jamaican (5.6%, a difference of 0.060%), and Immigrants from Barbados (5.6%, a difference of 0.090%).
| Demographics | Rating | Rank | Unemployment Among Ages 65 to 74 years |
| Immigrants | Haiti | 0.4 /100 | #255 | Tragic 5.6% |
| Native Hawaiians | 0.4 /100 | #256 | Tragic 5.6% |
| Immigrants | Southern Europe | 0.3 /100 | #257 | Tragic 5.6% |
| Immigrants | Western Africa | 0.3 /100 | #258 | Tragic 5.6% |
| Sierra Leoneans | 0.2 /100 | #259 | Tragic 5.6% |
| Immigrants | Barbados | 0.2 /100 | #260 | Tragic 5.6% |
| South Americans | 0.2 /100 | #261 | Tragic 5.6% |
| Immigrants | St. Vincent and the Grenadines | 0.2 /100 | #262 | Tragic 5.6% |
| Immigrants | Jamaica | 0.2 /100 | #263 | Tragic 5.6% |
| Pueblo | 0.2 /100 | #264 | Tragic 5.6% |
| Jamaicans | 0.2 /100 | #265 | Tragic 5.6% |
| French Canadians | 0.2 /100 | #266 | Tragic 5.6% |
| Guyanese | 0.2 /100 | #267 | Tragic 5.6% |
| Hawaiians | 0.2 /100 | #268 | Tragic 5.7% |
| Immigrants | Colombia | 0.1 /100 | #269 | Tragic 5.7% |